Accounts Receivable: From Basics to Advanced Automation
Accounts Receivable: From Basics to Advanced Automation
Unlock the potential of automation to transform your accounts receivable process. A comprehensive guide to leveraging technology for improved efficiency, accuracy, and cash flow management. Explore proven strategies and tools to reduce manual effort and accelerate payment cycles.
Nana Le
Published
Welcome to Accounts Receivable (AR)—where Managing Cash Flow is Both an Art and a Science! in a Rapidly Changing Economic Landscape With Challenges Like Inflation and Fluctuating Interest Rates, Effective Accounts Receivable Management is Crucial for Maintaining Financial Stability and Seizing New Opportunities.
AR is more than tracking who owes you money; it’s about keeping your business strong and agile. Whether you’re just starting or refining your skills, mastering Accounts Receivable is vital for smart financial decisions and long-term success.
This module will cover the essentials of Accounts Receivable (AR), from recognising and recording AR to setting credit policies and improving collections. We’ll also explore AR’s impact on your financial statements, helping you understand its role in the broader financial picture.
Accounts Receivable (AR) is like the heartbeat of your cash flow. When you sell goods or services on credit, the amount your customers owe you gets recorded as AR. These receivables are valuable assets, representing the cash you’re set to receive from credit sales. On your balance sheet, AR typically shows up under “Accounts Receivable” or “Trade Receivables” highlighting its role as a current asset.
AR isn’t just about tracking payments; it’s a key indicator of your financial health and operational efficiency. It helps you gauge liquidity, manage cash flow, and make strategic decisions.
Introduction to Accounts Receivable Management
Welcome to Accounts Receivable (AR)—where Managing Cash Flow is Both an Art and a Science! in a Rapidly Changing Economic Landscape With Challenges Like Inflation and Fluctuating Interest Rates, Effective Accounts Receivable Management is Crucial for Maintaining Financial Stability and Seizing New Opportunities.
AR is more than tracking who owes you money; it’s about keeping your business strong and agile. Whether you’re just starting or refining your skills, mastering Accounts Receivable is vital for smart financial decisions and long-term success.
This module will cover the essentials of Accounts Receivable (AR), from recognising and recording AR to setting credit policies and improving collections. We’ll also explore AR’s impact on your financial statements, helping you understand its role in the broader financial picture.
What is Accounts Receivable?
Accounts Receivable (AR) is like the heartbeat of your cash flow. When you sell goods or services on credit, the amount your customers owe you gets recorded as AR. These receivables are valuable assets, representing the cash you’re set to receive from credit sales. On your balance sheet, AR typically shows up under “Accounts Receivable” or “Trade Receivables” highlighting its role as a current asset.
AR isn’t just about tracking payments; it’s a key indicator of your financial health and operational efficiency. It helps you gauge liquidity, manage cash flow, and make strategic decisions.
As a financial guru Robert Kiyosaki emphasised in his book ‘Rich Dad Poor Dad’,
It’s not how much money you make. It’s how much money you keep.
Robert Kiyosaki, Financial Guru
Key Characteristics of Accounts Receivable:
Originates from Credit Sales: AR pops up when you allow customers to pay later for products or services.
Short-term Nature: Generally expected to be collected within a short period, adding to your working capital.
Impact on Cash Flow: Managing AR efficiently is crucial for keeping liquidity steady and funding daily operations.
Impact of Accounts Receivable on Financial Statements
Balance Sheet: AR is a current asset with a Debit nature, showing amounts expected to be collected within the operating cycle.
Income Statement: AR ties to revenue recognition, which is recorded when goods or services are delivered.
Cash Flow Statement: Changes in AR affect operating cash flows, reflecting how well sales are converted into cash
Recognition and Measurement of Accounts Receivable
Getting AR right is crucial for accurate financial reporting. Under Generally Accepted Accounting Principles (GAAP) and International Financial Reporting Standards (IFRS), AR must be recognised and measured correctly to keep financial statements clear and honest.
Recognition of Accounts Receivable
AR is recognised when:
Revenue is Earned and Realisable: You’ve delivered the goods or services and expect payment.
Customer Has a Legal Obligation to Pay: The customer owes you money as per the agreement.
Measurement of Accounts Receivable
Initial measurement:
Under GAAP: AR is recorded at the invoice price—no adjustments for bad debts yet.
Under IFRS: AR is recorded at the transaction price but considers potential credit risks from the start.
Subsequent Measurement:
Under GAAP: You estimate bad debts using methods like the allowance method, reducing AR to its expected net value.
Under IFRS: The expected credit loss model is used, factoring in current and future economic conditions for more accurate adjustments.
Example: Allowance for Doubtful Accounts
Imagine a wholesaler, N&N Ski Shop, with $250,000 in AR. They estimate that 5% might not be collected, so they record an Allowance for Doubtful Accounts of $12,500. This adjustment brings the net realisable value of AR down to $237,500.
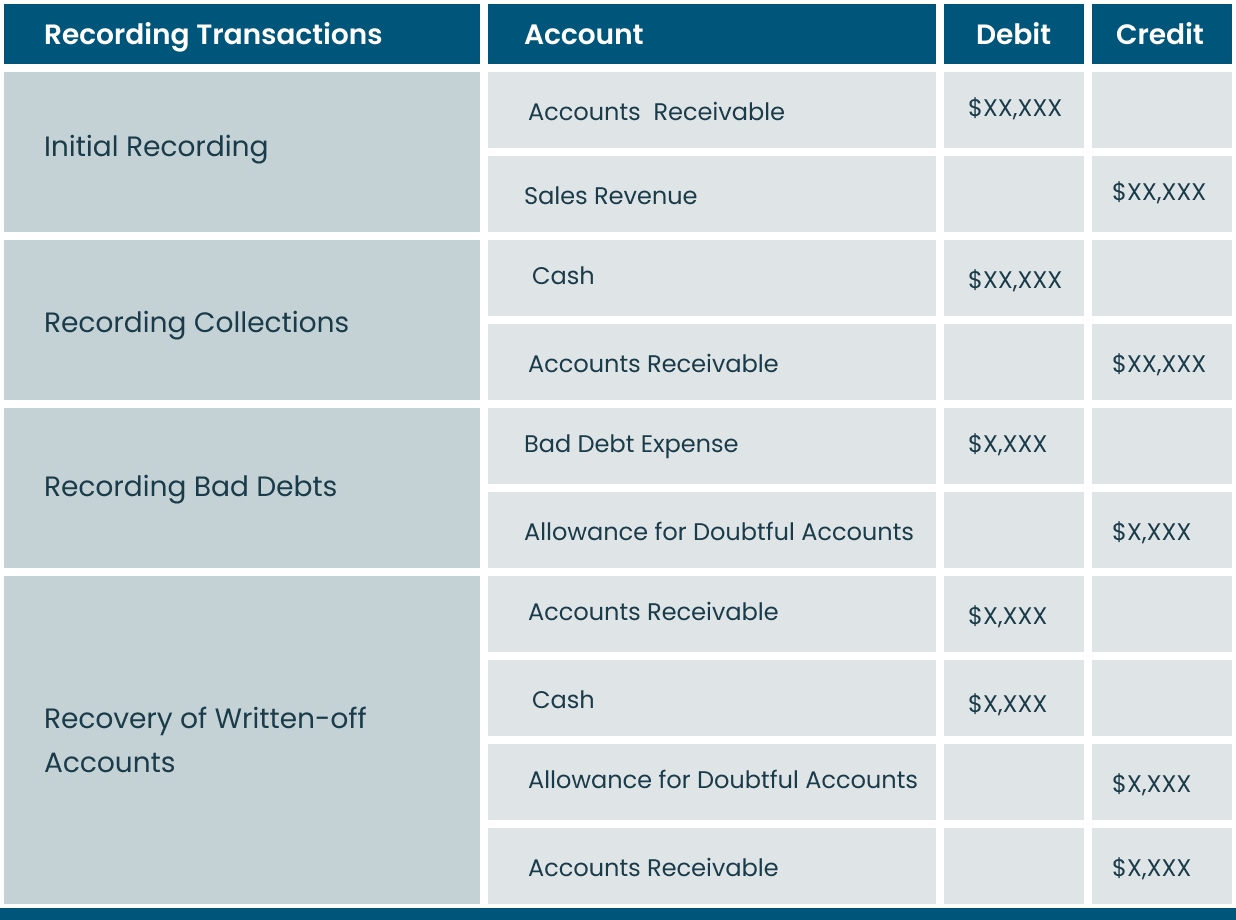
Journal Entry for Bad Debt Estimation
Debit: Bad Debt Expense ………… $12,500
Credit: Allowance for Doubtful Accounts ………… $12,500
Accounting for Accounts Receivable
Brain Exercise
Now, let’s put our knowledge into practice! Try answering the questions below:
Scenario 1: N&N Ski Shop has the following AR breakdown at the beginning of the day.
Customer A: $38,000 (due in 10 days)
Customer B: $12,000 (due in 25 days)
Customer C: $4,500 (due in 40 days)
If Customer A pays $17,000 today, how is the AR balance at the end of the day, and what will each customer owe?
Scenario 2: N&N Skip Shops just made a credit sale for $26,000. Record the journal entry for this transaction and the payment received 30 days later.
Key Concepts and Terminologies
Welcome to the exciting world of Accounts Receivable (AR), where understanding the right concepts and avoiding common pitfalls is key to keeping your financials in top shape. In this chapter, we’ll clarify the essential AR terms and dive into some easily misunderstood concepts, like the difference between AR and Accounts Payable (AP), which can lead to errors in financial statements if mixed up. Let's make sure you're on point!
Accounts Receivable (AR) Vs. Accounts Payable (AP)
When it comes to AR and AP, think of them as two sides of the same coin—AR is what customers owe you, and AP is what you owe your suppliers.
Accounts Receivable (AR): This refers to the invoices your business sends to customers for goods or services provided on credit. AR is money you’re set to receive, typically within 30 to 90 days, making it a valuable short-term asset.
Accounts Payable (AP): On the flip side, AP represents the amounts your business owes to suppliers or creditors. It’s recorded as a current liability on your balance sheet since it’s an obligation to pay out cash.
Key Differences Between AR and AP
Nature of Account: AR is money owed to the company (asset), while AP is what the company owes others (liability)..
Cash Flow Impact: AR brings in future cash, whereas AP involves future cash outflows..
Balance Sheet Classification: AR shows up as a current asset with Debit nature, while AP is listed under current liabilities with Credit nature.
Key Terms You Need to Know
Quote: is often used in business-to-business (B2B) transactions and helps establish clear expectations between buyers and sellers before a formal contract or order is finalised. It typically includes quantities, prices, and delivery terms.
Sales Order: is a confirmation of a sale that occurs once the customer accepts the quote and places an order. It outlines the order specifics, including requested items, quantities, prices, and delivery terms. It serves as the basis for generating an invoice once the order is fulfilled. In summary, it bridges the gap between the customer's purchase request and the company's fulfilment and billing, making it an essential part of the AR cycle.
Invoice: is a formal document issued by a seller to a buyer, detailing products, services, and the total amount due. In Australia, a tax invoice must comply with GST requirements, including the seller’s ABN and GST breakdown. (ATO, 2023)
Bad Debt Expense: Recognised when AR is determined to be uncollectible. This reduces taxable income and ensures financial statements align with principles of prudence and conservatism. It's about showing a realistic financial picture.
Allowance for Doubtful Debts: This is an estimate of the portion of AR that might not be collectible, recorded as a contra-asset account to present AR at its net realisable value. Compliance with AASB 9 in Australia ensures accuracy in reporting financial instruments.
Write-Off: When a receivable is deemed uncollectible, it's written off from AR, and a bad debt expense is recognized. This keeps your financial records clean and complies with AASB 9 standards.
Credit Risk: The possibility that a customer may fail to pay. Managing credit risk is all about finding that balance—offering credit to drive sales while minimising non-payment risks.
Aging Report: A critical tool in AR management, this report categorises invoices by how long they’ve been outstanding. It helps businesses monitor overdue payments, manage credit risk, and maintain a steady cash flow.
Key AR Metrics for Success
Days Sales Outstanding (DSO)
This measures how long it takes to collect payment after a sale. A low DSO means you're collecting receivables efficiently. Businesses in Australia often compare their DSO against industry standards for a competitive edge.
Formula
DSO = (Average Accounts Receivable / Total Credit Sales) × Number of Days
Example: The global DSO rose by 3 days to an average of 59 days in Q4 2023—the biggest increase since 2008.
Accounts Receivable Turnover Ratio
This ratio tells you how often a company collects its AR in a specific period. A high turnover ratio is a sign of strong liquidity and operational efficiency.
Formula
AR Turnover Ratio = Net Credit Sales / Average Accounts Receivable
Average Collection Period
This measures the average number of days it takes to collect AR. It helps businesses evaluate the efficiency of their credit and collection policies.
Formula
Average Collection Period = 365 Days * (Average Accounts Receivables / Net Credit Sales)
Average Collection Period = 365 Days / Receivable Turnover Ratio
Avoiding Common Terminology Mistakes
"Credit Terms" vs. "Payment Terms"
Credit terms describe the conditions of extending credit to a customer (e.g., "Net 30"), while payment terms detail how and when the payment should be made.
"Allowance for Doubtful Debts" vs. "Bad Debt Expense"
The allowance is an estimate based on future expectations (contra-asset on the balance sheet), while bad debt expense is the actual loss recorded when a specific AR is written off.
"Net Receivables" vs. "Gross Receivables"
Gross receivables reflect the total AR, while net receivables show the amount after accounting for potential bad debts. Make sure you’re reporting the right figures!
Brain Exercise
Time to flex those financial muscles! Try answering the questions below:
1. What are the primary differences between Accounts Receivable (AR) and Accounts Payable (AP)?
2. N&N Ski Shops has an average AR of $350,000 and total credit sales of $3,000,000 for the year. Calculate the Days Sales Outstanding (DSO).
3. Mr. Wise's Company has an average AR of $200,000 and annual net credit sales of $1,000,000. What is the Accounts Receivable Turnover Ratio?
The AR Process Overview
The AR process—think of it as the backstage crew making sure the spotlight is always shining on your business.
A smooth AR process means that invoices are issued on time, payments are collected promptly, and any hiccups with customer payments are handled like a pro. This keeps the cash flowing like a well-oiled machine, making sure your business doesn’t hit a financial speed bump.
The AR cycle is summarised in the diagram below.
Benefits of a Smooth AR Process
Predictable Cash Flow
A consistent and predictable inflow of cash enables better financial planning and ensures the business can meet its obligations.
Reduced Bad Debts
Timely follow-up on overdue accounts minimises the risk of non-payment, reducing bad debts and improving the overall financial standing.
Improved Customer Relationships
Clear communication and efficient invoicing practices foster trust, resulting in better customer satisfaction and long-term loyalty.
Consequences of a Poor AR Process
Cash Flow Problems
Delayed payments can create cash shortages, making it difficult to cover day-to-day expenses, pay staff, or invest in growth.
Increased Costs
The resources required to chase overdue payments—whether time or money—can detract from other important tasks, increasing operational costs.
Damaged Reputation
Consistent issues in collecting payments may negatively impact the business’s reputation with customers, suppliers, and other stakeholders.
Tools and Resources for Managing AR
Accounting Software – The Backbone of AR Efficiency
Modern accounting software is indispensable for efficient AR management. These tools automate numerous aspects of the AR process, including invoicing, payment tracking, and report generation.
Why Accounting Software Rocks:
Automation: Less manual work = fewer errors. Plus, who has time for data entry anyway?
Real-Time Tracking: Want to know who’s paid and who hasn’t? You’ll always have the latest info at your fingertips.
Popular Accounting Software:
Account Receivables Software – Enhancements to AR process
Accounts receivable software can make handling your cash flow easier. Here’s how it helps streamline your AR cycle:
Automated Invoicing: Get invoices sent out automatically!
Payment Tracking: Keep an eye on payments in real-time, so you never miss a beat.
Customer Portal: Let your customers view invoices and pay online, making it convenient for them!
Automated Reminders: Gentle nudges for late payments? Yes, please!
AR Aging Reports – Your Sneak Peek into Payment Patterns
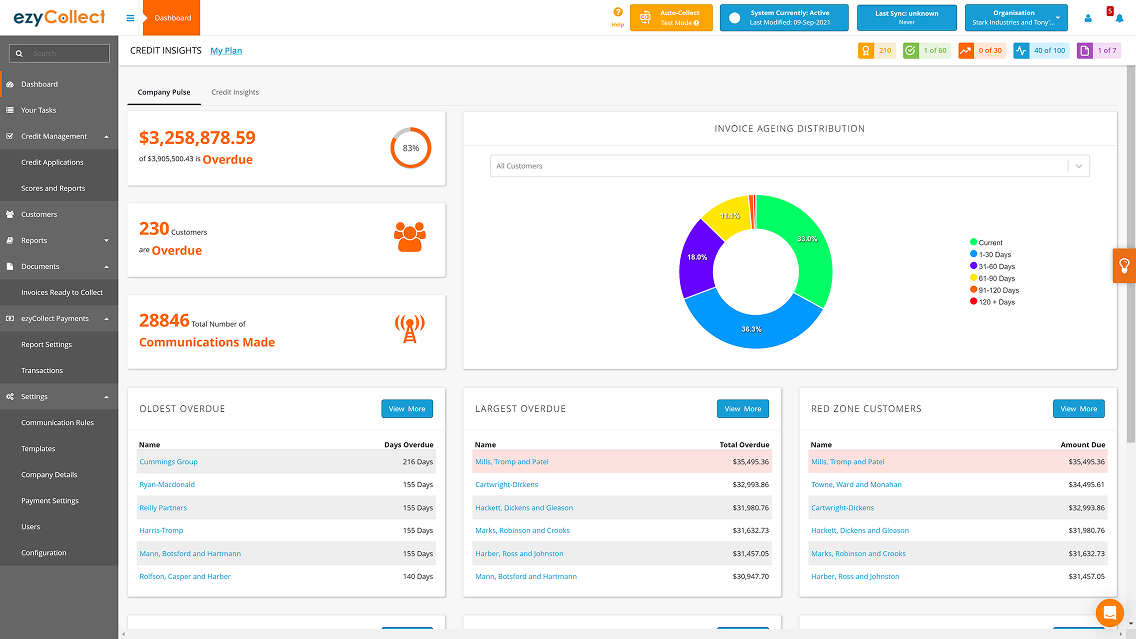
An AR Aging Report is like your business’s crystal ball, showing which customers are slacking on their payments. This nifty report helps determine who needs a friendly nudge and can seriously boost your collection efforts.
Typical AR Aging Report Categories:"
Current: Invoices not due yet (a sigh of relief for now).
30-60 Days Past Due: Time to start keeping an eye on these folks.
60-90 Days Past Due: Now we’re in serious territory. Follow-up time!
Over 90 Days Past Due: Sound the alarm! These need immediate attention.
Payment Reminders and Follow-Up Strategies
Ever heard the phrase, “The squeaky wheel gets the grease”? In AR, following up is everything! Automated payment reminders can save the day, gently nudging customers about upcoming or overdue payments.
Effective Follow-Up Strategies:
Friendly Reminders: A gentle reminder sent a few days before the payment is due.
Firm Follow-Up: For overdue accounts, a firm yet professional reminder should be sent shortly after the due date.
Escalation: If payment remains overdue for an extended period, escalation to a collections agency or legal action may be necessary.
Credit Management Policies – the Rulebook for Payment Peace
Want to avoid payment drama before it even begins?A solid credit management policy is your golden ticket. Set clear terms, check customer creditworthiness, and establish steps for when things go wrong.
Key Ingredients of a Credit Management Policy:
Credit Terms: Clearly outline payment terms, including any penalties for late payment.
Credit Checks: Conduct credit assessments on new customers before offering them credit to mitigate risk.
Collection Procedures: Establish a clear process for managing overdue payments, including when to send reminders and when to escalate.
Brain Exercise
Let’s see how well you’ve mastered the AR game with these brain teasers:
1. N&N Skip Shops company uses Xero accounting software to manage its AR. They spot the following in their AR Aging Report:
30-60 Days Past Due: $20,000
60-90 Days Past Due: $58,000
Over 90 Days Past Due: $12,000 If the company prioritises based on the total overdue amount, what percentage is from invoices more than 60 days past due?
2. Imagine you're running AR for a company using MYOB accounting software. They’ve got 800 overdue invoices with an average amount of $500 each. If they introduce automated reminders and cut the overdue amount by 40%, what’s the total overdue amount afterward?
The Financial Impact of Accounts Receivable (AR)
When managed effectively, AR can provide significant benefits to a business’s cash flow:
Predictable Cash Inflows: AR offers a reliable forecast of incoming cash, allowing businesses to plan and allocate resources more efficiently.
Customer Loyalty: Extending credit terms can help strengthen relationships with customers, fostering loyalty and encouraging repeat business.
However, improper management of AR can also create challenges:
Bad Debts: In cases where customers fail to pay, businesses may encounter bad debts, which reduce cash flow and profitability.
Delayed Payments: If customers are slow to pay, it can lead to cash flow shortages, making it difficult to meet financial commitments.
The Impact of AR on Revenue and Profitability
Revenue: While AR represents potential revenue, it is not considered actual income until payment is received. A high AR balance does not guarantee profitability, as revenue is only realised when cash is collected.
Profitability: AR can negatively impact profitability if businesses invest too much time and money in chasing overdue payments. This can include administrative costs and interest expenses from short-term borrowing to cover cash shortfalls.
Balancing AR to Protect Profitability
To maintain profitability, businesses need to balance offering credit to boost sales with ensuring timely payment collection. Best practices include:
Credit Checks: Conduct thorough checks to assess customers’ ability to pay before extending credit.
Clear Payment Terms: Set transparent and consistent payment terms to avoid disputes and delays.
Regular Monitoring: Use AR ageing reports to track overdue invoices and prioritise follow-up actions.
Flexible Payment Options: Offer convenient payment methods like Direct Debit, Bank Transfer, and payment links attached to invoices.
Common AR Challenges
Late Payments: A frequent issue for businesses, late payments can disrupt cash flow, making it difficult to meet obligations such as paying suppliers and staff.
Bad Debts: When customers fail to pay, the result is a direct loss for the business.
Disputed Invoices: These disputes can delay payments and require additional resources to resolve.
High Days Sales Outstanding (DSO): High DSO indicates that it is taking longer than ideal to collect payments, which ties up cash.
Inconsistent AR Processes: Without standardised procedures, businesses may experience confusion, errors, and inefficiencies in collecting payments.
Strategies for Managing AR Challenges
Clear Credit Policies
Establish clear credit policies to prevent AR issues before they arise. These should include eligibility criteria for extending credit and steps to take when payments are overdue.
Example:
Credit Check – You can require prospective customers to complete a credit application and pass a credit check before extending credit. By evaluating customer profiles, you can set payment terms based on their credit history, aligned with your company’s risk tolerance.
Automating Invoicing and Reminders
Automating the invoicing process and sending payment reminders can significantly reduce the risk of late payments and minimise disputes.
Example:
Post-Due Date Follow-Ups – For invoices that are 30 days overdue, AR software like ezyCollect can automate reminders. The system sends a series of escalating follow-up emails as the delay continues, ensuring proactive communication with customers.
Regular AR Reviews
Frequently reviewing AR ageing reports helps identify overdue accounts early, enabling prompt follow-up and reducing the risk of bad debt.
Example:
Real-Time AR Reports – With AR software, businesses can generate real-time ageing reports that show overdue accounts, upcoming payments, and cash flow projections. This allows AR managers to make informed decisions, improving cash management and freeing time for other critical tasks.
Incentives for Early Payment
Offering incentives for early payment encourages customers to settle invoices before the due date, improving cash flow and reducing the number of ageing AR accounts.
Example:
Early Payment Discount – You can offer 2%/10 Net 30, which means your customers who have net-30-day terms now have the option to get a 2% discount if they pay in ten days.
Managing AR in the Australian Context
In Australian accounting, technology plays a pivotal role in streamlining AR management. Platforms like MYOB, Xero, and QuickBooks can enhance AR efficiency by automating processes and providing real-time tracking.
Benefits include:
Automation: Reduces manual errors and speeds up the invoicing process.
Real-Time Data: Allows businesses to monitor outstanding invoices and payments with up-to-date information.
Insights: Provides data analytics and reports to help businesses identify trends and manage AR proactively.
Compliance with Australian Accounting Standards
Adhering to Australian Accounting Standards (AASB) is essential for accurate financial reporting. Businesses must ensure their AR processes are compliant, particularly regarding the recognition of revenue and the accurate reporting of AR on financial statements.
Continuous Training and Development
Ensuring that staff responsible for AR are well-trained in best practices is crucial for smooth operations. Regular training helps improve efficiency and reduces errors, keeping the team equipped with the latest tools and knowledge.
Building Strong Customer Relationships
Maintaining strong relationships with customers is key to better payment practices. Trust and open communication can reduce disputes and foster a cooperative environment for managing AR.
Brain Exercise
Time to Flex Those AR Muscles!
1. N&N Skip company had a Days Sales Outstanding (DSO) of 60 days. After implementing a new policy, the DSO improved to 45 days. If the company’s annual credit sales total $1.2 million, how much has their AR decreased with this improved DSO?
2. Imagine you are the AR manager of a company that just implemented an automated invoicing system. In the first quarter, DSO decreased from 75 days to 50 days, and overdue invoices dropped by 30%. How would these changes impact the company’s cash flow and profitability?
Conclusion
Accounts Receivable is a vital component of a company’s financial health, representing money owed for goods or services sold on credit. Proper AR management can boost cash flow and protect profitability. This guide has explored the impact of AR on cash flow, revenue, and profitability, alongside best practices for managing AR within an Australian context.
Key Takeaways:
AR represents potential future cash inflows but needs careful management to ensure collection.
Proper AR management protects cash flow and profitability by reducing risks associated with late payments and bad debts.
Tools like AR ageing reports, credit policies, and automation are essential for effective AR management.
Consistent processes and clear communication with customers can mitigate common AR challenges.
Setting Up an Effective Accounts Receivable Process
Introduction
Mastering the Accounts Receivable cycle goes beyond routine bookkeeping—it’s about leveraging data-driven insights, embracing automation, and optimising financial workflows. From invoicing and collections to reconciliation, each stage plays a critical role in maintaining a company's cash flow and overall financial health.
In the previous module, we explored the fundamentals of Accounts Receivable. Now, let’s take a deeper dive into how the Accounts Receivable and Order to Cash processes work.
Ready to elevate your receivables management insights? Let’s get started!
The Accounts Receivable (AR) Cycle Overview
Does this look familiar? Let’s take a moment to refresh our memory before delving into details of each step. 😊
Step 1: Sales Order
What is a Sales Order?
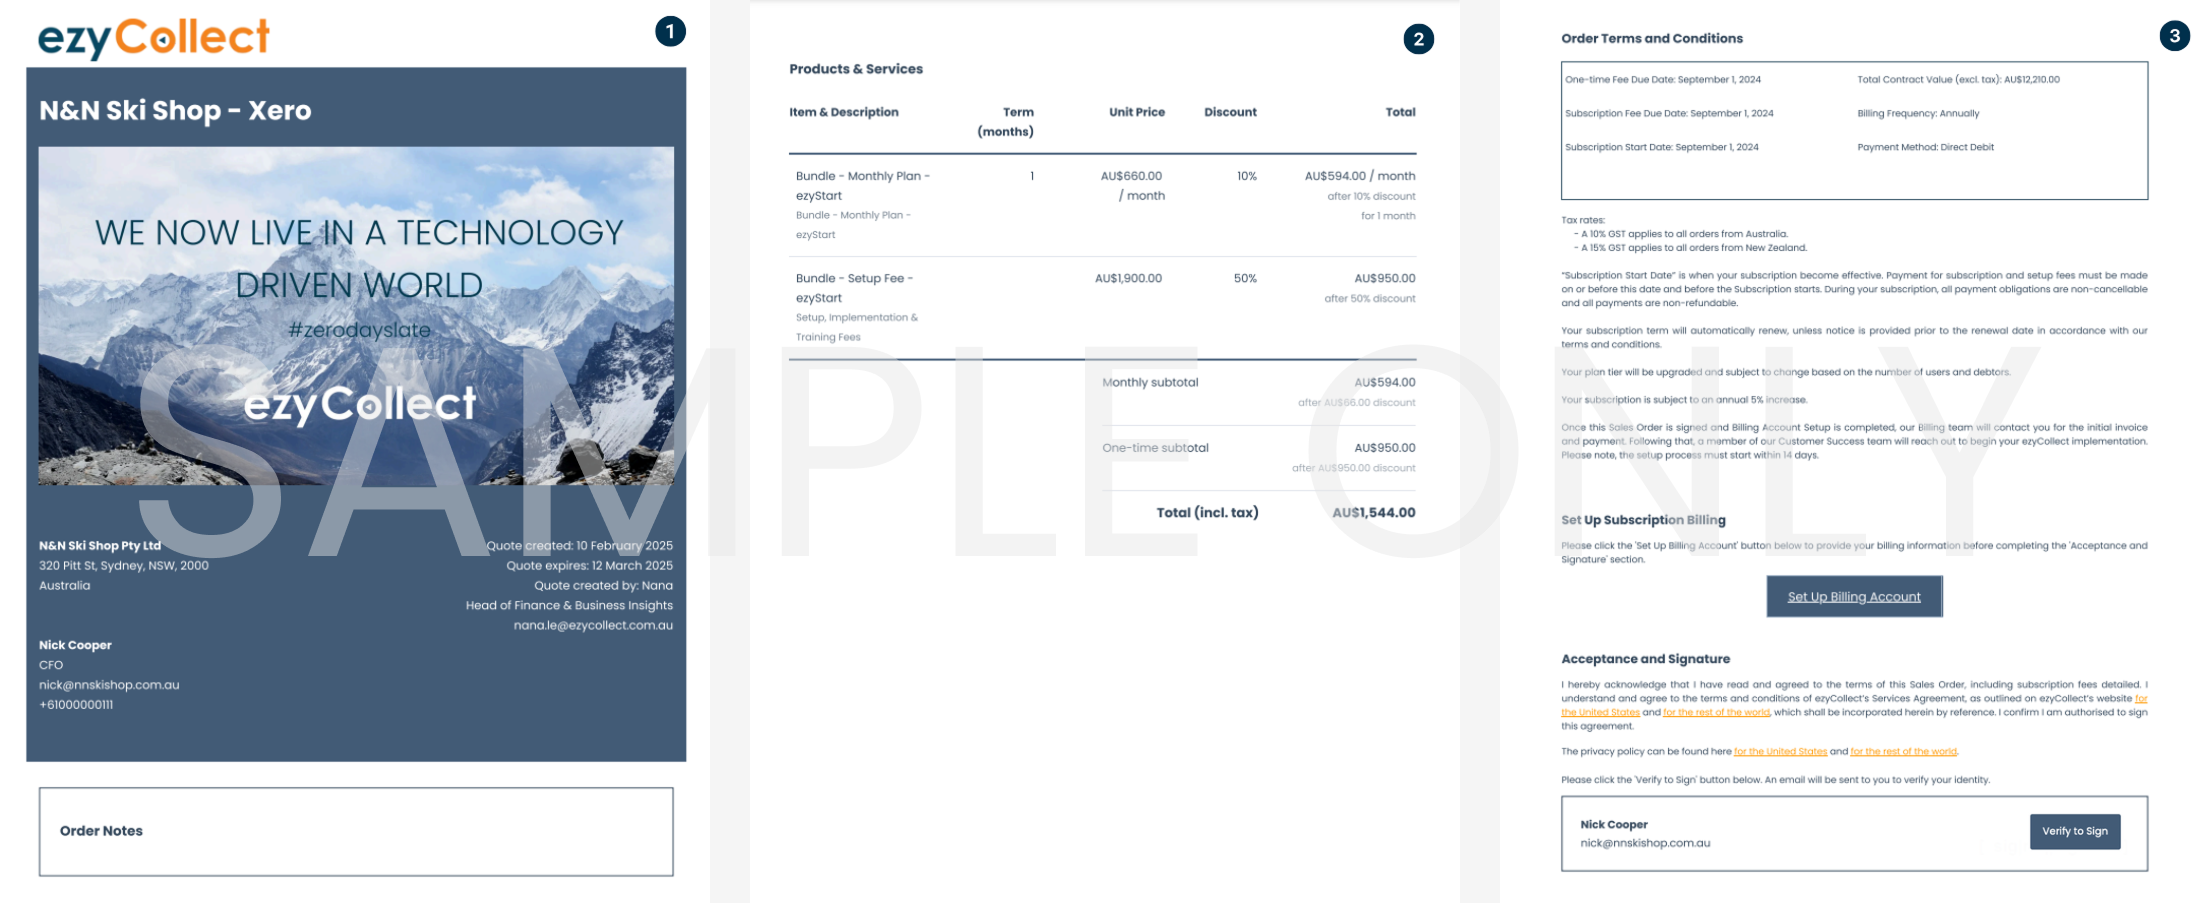
A Sales Order is a formal confirmation of a sale once a customer accepts a quote and places an order. It serves as a binding agreement that outlines key details such as product or service type, quantity, price, and terms of sale. Beyond documentation, the Sales Order ensures alignment across sales, operations, and finance, preventing miscommunication and streamlining order fulfillment. It acts as a bridge between the customer's purchase request and the company's fulfillment and billing processes, making it an essential first step in the AR cycle.
Note: A quote is generally different from a sales order. A quote is a non-binding price estimate provided to a customer before they commit to a purchase, serving as a proposal rather than a confirmation. In contrast, a sales order is a formal commitment to buy, triggering order processing and fulfillment. However, some companies use these terms interchangeably depending on their internal processes.
Example of a Sales Order
Key Components of a Sales Order
Customer Information – Includes the customer's name, billing address, shipping address, and contact details to ensure accurate invoicing and delivery.
Order Date – The date on which a customer places an order for goods or services
Sales Order Number – A unique identifier for tracking and reference.
Product and/or Service Details – Description of the goods or services, including quantity, unit price, and total price for clarity in processing.
Payment Terms – Specifies the due date for payment (e.g., Net 30 days) and accepted payment methods.
Delivery Information – Shipping method, estimated delivery date, and any special instructions to ensure smooth logistics.
Taxes and Discounts – Breakdown of applicable taxes, discounts, or promotional offers impacting the total cost.
Approval and Signatures – Some businesses require internal approvals or customer signatures before processing the order.
Step 2: Credit Application
What is a Credit Application?
A credit application is a credit assessment conducted during the onboarding process. This may involve conducting a credit check, reviewing payment history, or analysing financial stability of the new customer, to determine their creditworthiness for trading and/or extended terms.
Based on your company's credit policy, you can:
Approve credit for eligible customers.
Deny credit if the risk is too high.
Suggest alternative payment methods (e.g., upfront payment or shorter payment terms) to mitigate risk.
This step helps protect your business from potential bad debt while ensuring a smooth Order-to-Cash process.
Note: some businesses refer to credit applications as an onboarding form or incorporate the credit assessment in the ordering process.
Key Components of a Credit Application
Customer/Business Details – Name, government unique identifier (ABN/ACN/NZBN/EIN), and contact information.
Credit Limit Request – Amount sought and justification.
Trade References – Supplier contacts to verify payment history.
Banking Information – Bank name and account details.
Financial Information – Statements or tax returns for larger credit amounts.
Payment Terms & Conditions – Due dates, late fees, and early payment discounts.
Personal/Director’s Guarantee – Owners may be required to personally cover debts.
Consent for Credit Check – Approval for checks via agencies like Equifax or illion.
Declaration & Signature – Agreement to terms and conditions.
Note: Nowadays, businesses can streamline the credit check process by using credit providers to assess new customers directly, eliminating the need for manual paperwork. These automated credit applications provide instant access to a customer's credit history, credit score, trading references, and even recommended credit limits, enabling faster and more informed credit decisions.
Reducing Bad Debt & Payment Defaults – Helps mitigate financial risk by ensuring credit is only extended to customers with a proven track record.
Enhancing Cash Flow Management – Ensures businesses grant credit responsibly, maintaining a healthy balance between sales growth and liquidity.
Step 3: Invoicing
What is an Invoice?
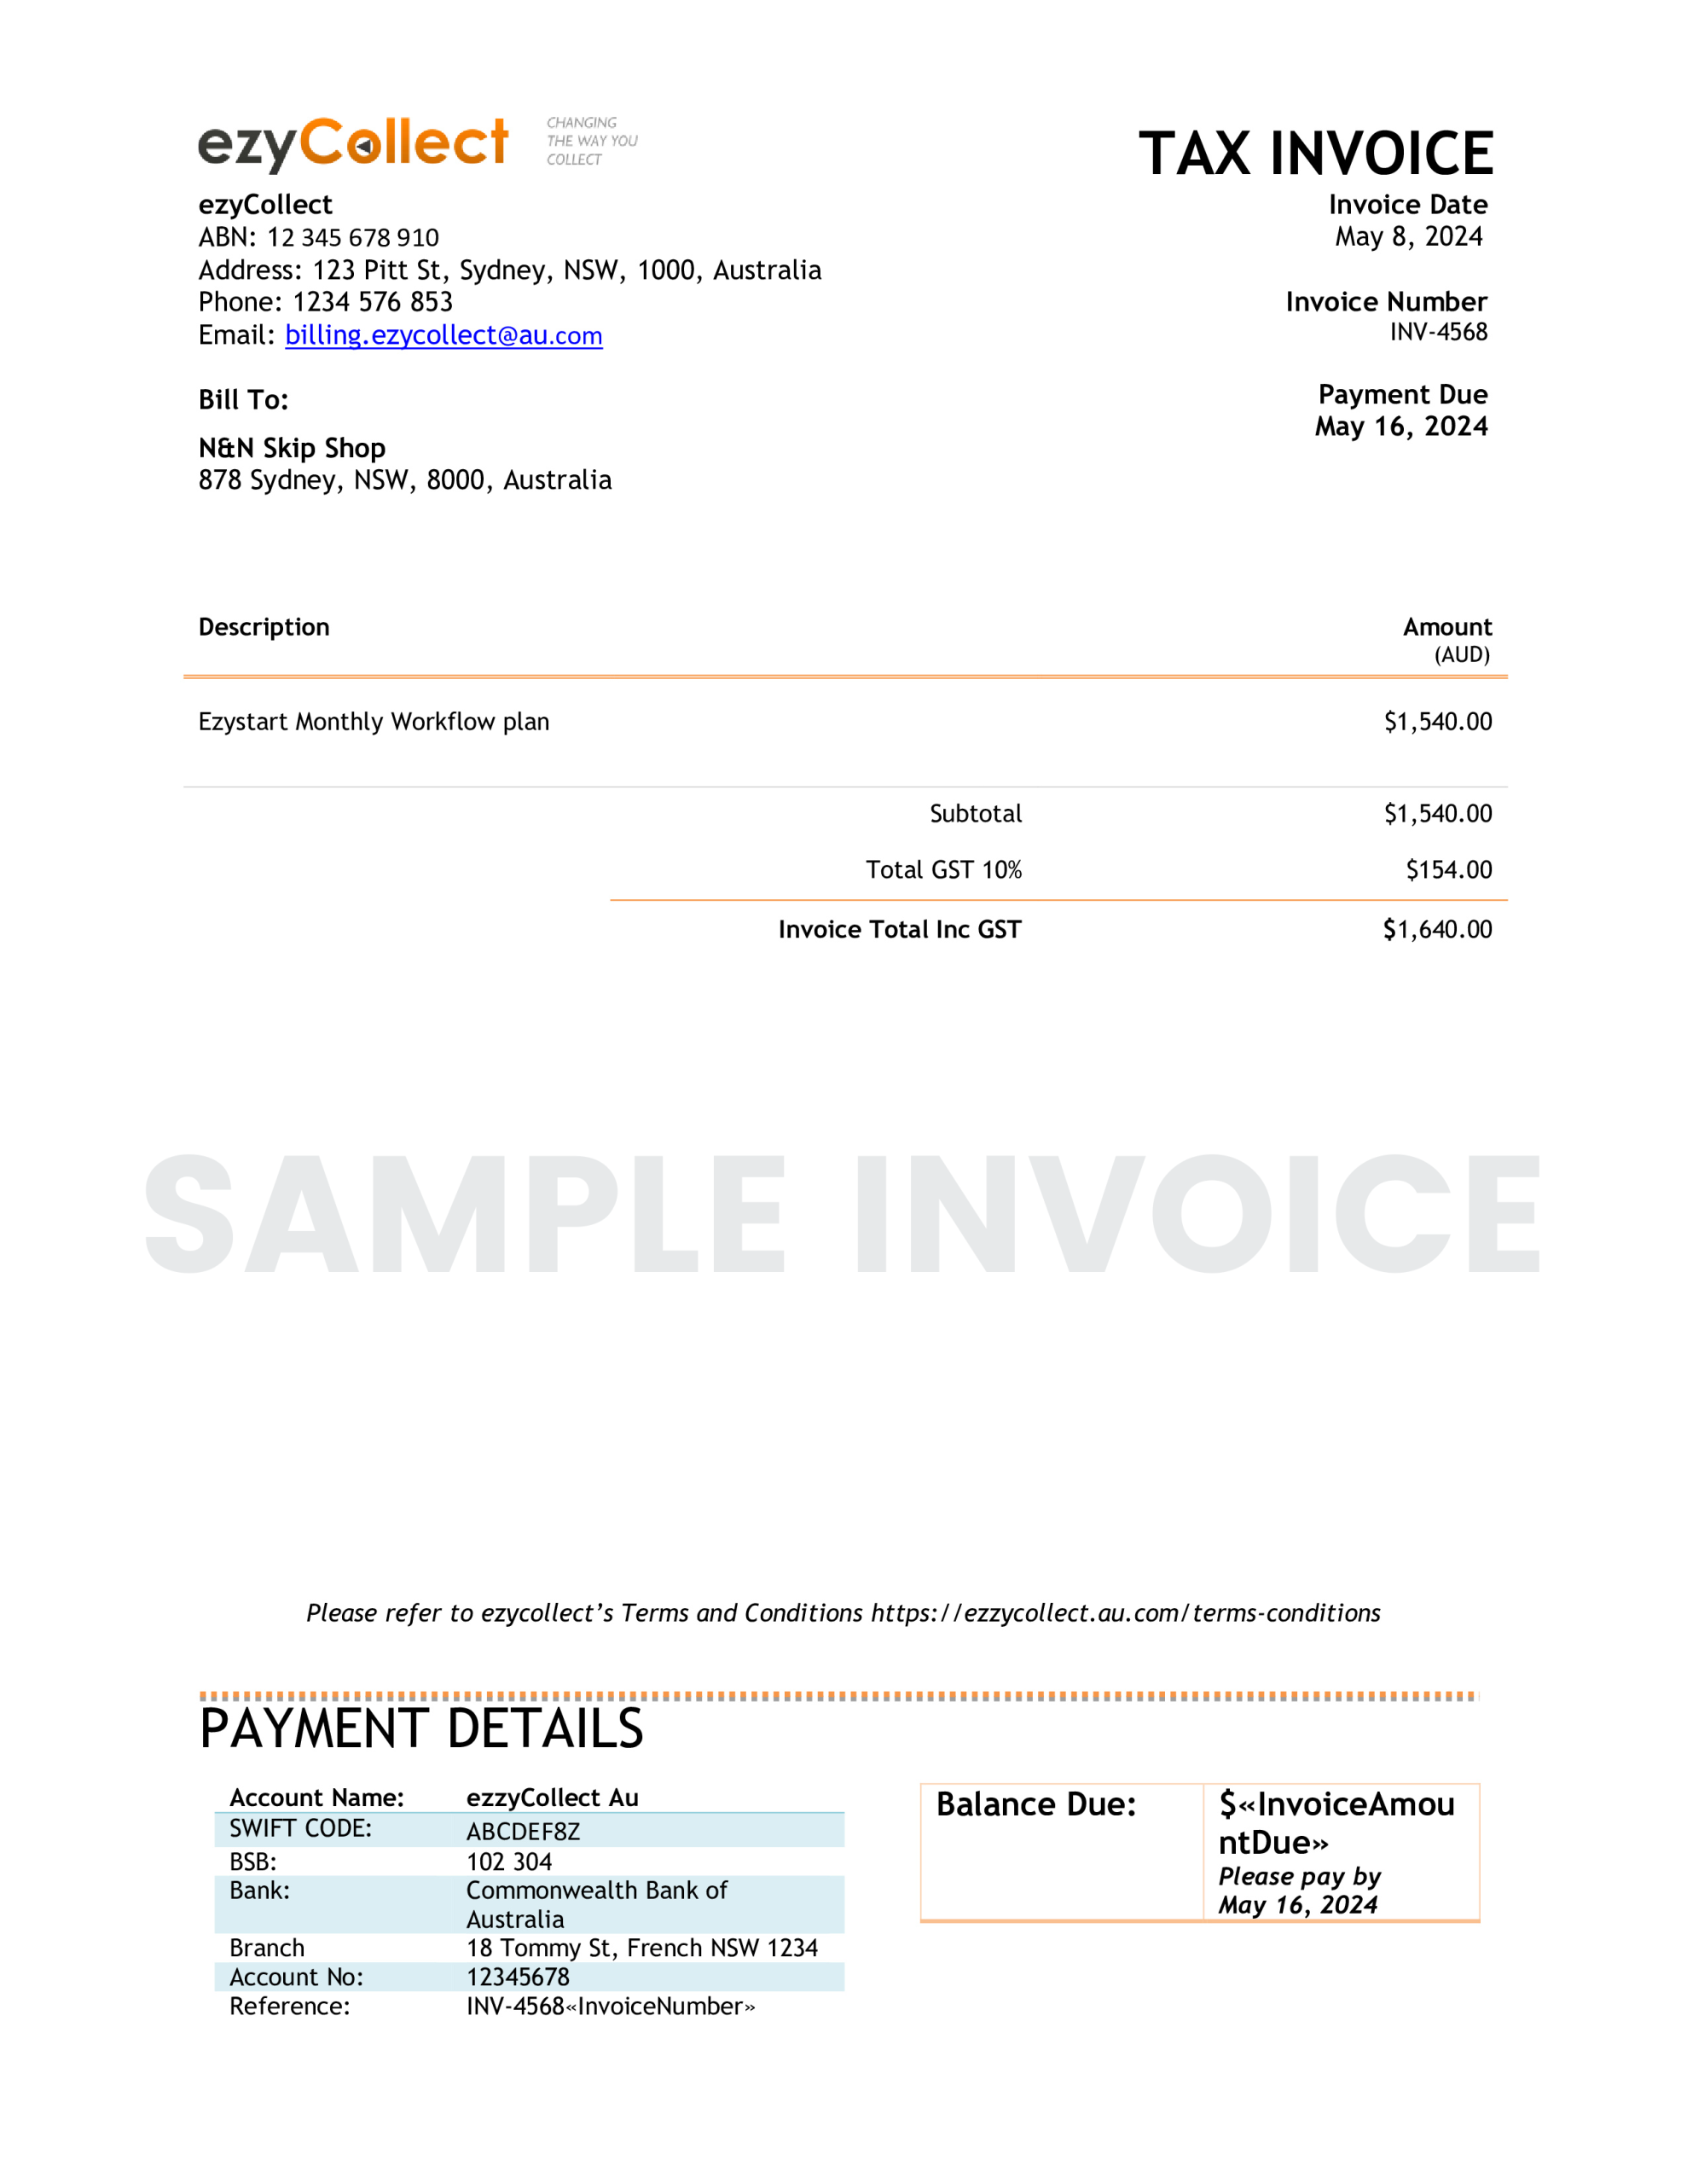
An invoice is a formal document issued by a seller to a buyer, detailing products, services, and the total amount due. In Australia, a tax invoice must comply with GST requirements, including the seller’s ABN and GST breakdown. (ATO, 2023)
Example of an Invoice:
Key Components of Tax Invoice
Supplier’s Identity and ABN: The supplier's name or trading name and Australian Business Number (ABN).
Seller’s Identity and ABN: The seller’s name or trading name and Australian Business Number (ABN).
Date of Issue: The date the invoice is issued.
Invoice Number: A unique identifier for the invoice.
Description of Goods or Services: Details of the items supplied, including quantity and price.
GST Amount: The amount of GST payable for each item and the total GST amount.
Total Price: The total amount payable, including GST.
Note: The components of your invoice may vary based on the invoice amount and the specific legal requirements of your jurisdiction.
Key Roles of an Invoice in the AR Cycle
Triggering the Receivable – Once an invoice is issued, it formally records the amount a customer owes, creating an accounts receivable entry in the company’s books.
Defining Payment Terms – The invoice specifies due dates, payment methods, and any applicable late fees or early payment discounts, ensuring clear expectations for both parties.
Supporting Reconciliation – The invoice serves as a reference for matching payments with outstanding receivables, helping finance teams track which invoices are paid, overdue, or disputed.
Enabling Collections and Follow-ups – If payments are delayed, the invoice acts as a formal basis for follow-ups, automated reminders, and potential escalation (e.g., late fees or debt collection).
Ensuring Compliance and Audit Readiness – Since invoices contain legally required details (such as GST breakdowns in Australia), they are essential for tax compliance and internal audits.
Step 4: Collection
What is Accounts Receivable (AR) Collection?
AR collection refers to the process of collecting payments from customers for goods or services that have been provided on credit. It is a critical aspect of managing cash flow and ensuring that a business receives timely payments for outstanding invoices. The AR collection process typically involves:
Invoicing – Issuing bills or invoices for goods or services rendered (Refer to step 3 for more details).
Payment Follow-up – Contacting customers to remind them of unpaid invoices and follow up on overdue payments.
Negotiation – Working with customers to resolve any payment disputes or concerns, and setting up payment plans if necessary.
Receipts & Recording – Tracking payments received and updating financial records accordingly.
Escalation – In cases of persistent non-payment, escalating the issue to debt collection agencies or legal action.
Effective AR collection is vital for maintaining healthy cash flow, minimising overdue accounts, and reducing the risk of bad debts.
Example of AR Collection by Stage
Businesses often rely on an ageing report to categorise receivables based on how long they’ve been overdue. Accounts that remain unpaid beyond the due date follow a structured collections process, which includes reminders and follow-ups. If payment is not received within the agreed time frame, the process may escalate to more direct actions, such as a final call or referral to a debt collection agency.
Here’s an example of typical escalation time frames for collections outreach:
This structured approach ensures a consistent, professional, and escalating process to collect payments and manage overdue accounts effectively.
Step 5: Reconciliation
What is Reconciliation?
Reconciliation in Accounts Receivable (AR) is the process of aligning customer transaction records, including invoices, credit memos, and payments, with the corresponding entries in the general ledger. This ensures the accuracy and completeness of financial records, confirming that the company's reported figures match actual transactions and outstanding balances.
In AR, reconciliation typically involves the following steps:
Matching Payments to Invoices – Ensuring that customer payments are correctly applied to outstanding invoices.
Reviewing Discrepancies – Identifying any differences between the recorded payments and the amounts due, including overpayments, underpayments, or missed payments.
Identifying Unresolved Transactions – Flagging transactions that have not been settled or recorded correctly.
Ensuring Consistency – Ensuring that the AR ledger balances match the cash receipts, adjustments, and credits, and reconciling them with the company's overall financial records.
Generating Reports – Creating detailed reports to track any discrepancies and provide insights into cash flow, unpaid invoices, and overdue accounts.
Effective reconciliation in AR helps businesses maintain accurate financial records, minimise errors, ensure correct reporting, and improve cash flow management.
Key Types of Reconciliation
Customer Account Reconciliation: Aligns customer balances with the general ledger, identifying discrepancies such as unapplied payments, duplicate entries, or missing payments.
Payment Reconciliation: Ensures that payments received are accurately recorded and matched against invoices and bank deposits. It helps identify unallocated payments or payment discrepancies to maintain accurate cash flow records.
Bank Reconciliation: Matches AR transactions with bank deposits to identify unrecorded deposits or bank charges affecting AR balances.
AR Ageing Reconciliation: Ensures the AR ageing report matches the general ledger, providing insights into overdue accounts and cash flow management.
Intercompany Reconciliation: Ensures accuracy of receivable balances in transactions between related entities, resolving any timing differences or mismatches.
These reconciliations are vital for ensuring accurate financial data, tracking cash flow, and maintaining consistency in accounts.
Order to Cash Cycle
In the dynamic world of accounting, the Order to Cash (O2C) process is crucial for maintaining strong financial management and ensuring cash flow stability. This process covers several critical steps, from the issuance of invoices to the collection of payments from customers. Understanding the details of the O2C process is essential for effective receivables management and keeping cash flow on track.
Let’s explore this process further!
What is Order to Cash?
Order to Cash (O2C) is the end-to-end process that companies use to manage the entire journey of a customer’s order—from receiving the order to collecting payment. This process ensures that goods or services are delivered as promised, and payment is collected efficiently.
The O2C cycle typically includes several key steps:
Order Management – Receiving and validating customer orders.
Credit Management – Assessing the customer's creditworthiness.
Order Fulfillment – Shipping the goods or delivering services to the customer.
Invoicing – Issuing an invoice to the customer for the goods or services provided.
Payment Collection – Receiving payment from the customer for the invoice issued.
Accounts Receivable – Recording and reconciling the payment against the customer’s account.
Efficient management of the O2C process is crucial for ensuring timely payments, maintaining healthy cash flow, and enhancing overall customer satisfaction.
What Are the Differences Between Accounts Receivable Cycle and Order to Cash Cycle?
The Accounts Receivable (AR) Cycle and Order to Cash (O2C) Cycle are both essential for managing a company’s revenue. They can overlap, but each focuses on different aspects of financial operations.. Here's how they differ:
1. Scope
AR Cycle: Primarily focuses on the management and collection of outstanding payments. It includes activities like invoicing, payment processing, credit management, and managing overdue accounts.(Refer to Chapter 2.1 for more details)
O2C Cycle: Encompasses a broader range of steps, from receiving customer orders to collecting payments. It covers everything from order entry to cash receipt and includes areas like sales order management and product/service delivery.
2. Steps Involved
3. Focus
AR Cycle: Focuses on the revenue collection and ensuring all receivables are tracked and payments are received on time.
O2C Cycle: Focuses on the entire customer transaction process, ensuring the order is processed, fulfilled, invoiced, and paid.
4. Financial Management
AR Cycle: Is part of the Accounts Receivable function and is centered on keeping track of outstanding payments and reconciling accounts.
O2C Cycle: Is a cross-departmental process that involves sales, operations, and finance, and is focused on the end-to-end journey of an order and payment.
5. Goal
AR Cycle: The goal is to ensure timely payment, reduce outstanding receivables, and optimise cash flow by following up on overdue accounts and resolving discrepancies.
O2C Cycle: The goal is to provide an efficient, seamless process from the moment a customer places an order to when payment is received and recorded.
In short, the AR Cycle is a subset of the O2C Cycle, focusing specifically on payment collection and management of receivables, while the O2C Cycle covers the full spectrum of order fulfillment and payment receipt.
Order-to-Cash (O2C) Cycle: Key Steps and Differences From the Accounts Receivable (AR) Cycle
The Order-to-Cash (O2C) cycle and the Accounts Receivable (AR) cycle are closely linked, but they focus on different parts of the financial operations of a business. While AR primarily focuses on tracking, managing, and collecting outstanding payments, O2C covers the entire process from receiving an order to the point at which cash is collected and recognised.
Here is an in-depth look at each step of the O2C cycle and how it contrasts with the AR cycle:
1. Order Management — Receiving and Validating Customer Orders
O2C:The process begins with the receipt of a customer order, which is entered into the company’s order management system. At this stage, businesses verify that the customer’s order is accurate and that the requested products or services are available. Any errors in order details or stock availability are resolved at this point.
Difference from AR Cycle: The AR cycle does not include this step, as its focus starts when the transaction is completed, typically after the order has been fulfilled. The AR cycle deals primarily with the management and collection of amounts due after the invoice is issued.
2. Credit Management – Assessing the Customer's Creditworthiness
O2C:Credit management is a critical step in the O2C cycle, where the business assesses the customer's credit risk before processing the order. This involves reviewing the customer’s credit history, financial standing, and credit limit. Based on this, a decision is made whether to proceed with the order and if payment terms should be adjusted to reduce risk.
Difference from AR Cycle:Traditionally, this step is not typically part of the AR cycle. However, nowadays, credit management can form part of the AR cycle, depending on the business’ structure and policies, to ensure that potential bad debt risks are minimised early on in the process.
3. Order Fulfillment – Shipping Goods or Delivering Services
O2C: After the credit approval and order confirmation, goods are shipped, or services are delivered to the customer. This step is about ensuring timely and accurate delivery. It involves logistics, warehousing, and inventory management to ensure the correct products reach the customer as ordered.
Difference from AR Cycle: The AR cycle does not involve the delivery of goods or services. The AR team is focused on tracking payments rather than handling the fulfillment of orders.
4. Invoicing – Issuing an Invoice to the Customer
O2C: After goods are delivered or services are rendered (conditions might vary depending on your agreements), an accurate invoice is generated and sent to the customer. The invoice includes all relevant details such as product descriptions, quantities, prices, and payment terms. Ensuring accuracy here is crucial to avoid disputes or delays in payment. The O2C process may also involve generating recurring invoices for subscription-based services.
Difference from AR Cycle: In the AR cycle, invoicing is an essential step as well, but it focuses more on the management of issued invoices rather than their creation. In the AR cycle, teams ensure that all invoicing is recorded properly in the accounts ledger and track outstanding balances from customers.
5. Payment Collection – Receiving Payment from the Customer
O2C: The payment collection phase involves receiving payments from customers for the issued invoices. Payment methods may include ACH, credit cards, checks, or wire transfers. At this stage, businesses focus on ensuring that the customer makes timely payments according to the agreed-upon terms. Businesses may use reminders, automated systems, or customer service to facilitate smooth payment collection.
Difference from AR Cycle: Collection is a critical step in both the O2C and AR cycles. Ensuring timely payment—both for due and overdue invoices—requires close collaboration across teams. By aligning efforts between sales, finance, and customer service, businesses can streamline collections, minimise delays, and maintain healthy cash flow.
6. Accounts Receivable – Recording and Reconciling the Payment Against the Customer’s Account
O2C: After receiving the payment, the payment needs to be recorded and matched with the corresponding invoice. This step ensures that the customer’s outstanding balance is reduced appropriately.
Difference from AR Cycle:The AR cycle takes over at this point. AR is responsible for managing customer balances, ensuring that payments are recorded accurately, and reconciling discrepancies. AR teams also focus on the follow-up process, ensuring timely collections and addressing any issues like unapplied payments, discrepancies, or credits. The AR cycle focuses on the ongoing management and aging of receivables, whereas the O2C cycle handles the entire process from order initiation to payment receipt.
Conclusion
While both the O2C and AR cycles focus on the efficient management of receivables, they differ in scope and focus. The O2C cycle covers the end-to-end process from order receipt to cash collection, ensuring smooth operations and financial health by managing customer orders, credit, delivery, invoicing, and payment collection. In contrast, the AR cycle focuses primarily on the tracking, recording, and management of payments after invoices are issued, with a significant emphasis on the ongoing collection process and reconciling outstanding balances. Both cycles are interdependent, but they play distinct roles in maintaining financial accuracy and cash flow management.
Structuring Accounts Receivables for Scalability
Preparing for Growth: Scaling Accounts Receivable (AR) for Future Expansion
In today’s fast-moving financial world, scalable Accounts Receivable (AR) processes are essential for growth and stability. As businesses expand, AR systems must handle increasing transaction volumes, complexity, and customer demands without disrupting cash flow.
A well-structured AR system fuels business growth by ensuring smooth collections, preventing bottlenecks, and maintaining liquidity.
Revenue is vanity, profit is sanity, but cash flow is reality.
Alan Miltz
Efficient AR management is key to long-term success. Scalability isn’t just about keeping up—it’s about staying ahead. A strong AR foundation ensures businesses are ready for whatever the future holds.
Impact of Growth on AR Processes
As a business scales, its transaction volume inevitably rises, resulting in more invoices, payments, and potential discrepancies. If AR processes aren’t scalable, this growth can overwhelm existing systems, causing delayed collections, increased errors, and, ultimately, strained customer relationships.
Scalable AR systems ensure that even with increased transaction volumes, the process remains efficient and effective, enabling the finance team to focus on strategic tasks rather than being bogged down by operational inefficiencies. These systems allow for seamless management of cash flow, ensuring financial stability and allowing businesses to scale without fear of liquidity challenges.
Risks of Non-Scalable AR Systems
A non-scalable AR system presents a myriad of risks that can undermine a company’s financial health and long-term success:
Cash Flow Disruptions: Inefficient AR processes lead to delayed collections, causing cash flow shortfalls and forcing businesses to rely on expensive external financing.
Operational Inefficiencies: Outdated systems and manual processes increase the likelihood of errors, duplication of work, and administrative burdens, reducing productivity and hampering the company’s ability to meet financial obligations.
Damaged Customer Relationships: Mistakes in invoicing or delays in payment can damage relationships with customers, ultimately impacting customer retention and future revenue growth.
Elements of Scalable Accounts Receivable (AR) Processes
In a continuously evolving business environment, scalable AR processes are essential to ensure efficiency and financial stability. Here are the key elements of a successful scalable AR system:
1. Automation and Technology Integration: The Backbone of Scalability
Automation and seamless technology integration are essential for scaling AR efficiently. Connecting AR with ERP and accounting software ensures real-time visibility, improves accuracy, and optimises cash flow management.
Key Benefits:
Efficiency Gains: Eliminates manual tasks, reduces errors, and streamlines processes.
Improved Accuracy: Minimises human errors for reliable financial reporting.
Seamless Scalability: Adapts to growing transaction volumes without added complexity.
2. Standardisation of AR Processes: Building Consistency and Efficiency
Establishing clear policies for invoicing, payment terms, and credit management reduces complexity and enhances financial control.
Key Benefits:
Consistent Invoicing: Reduces confusion and speeds up payment cycles.
Clear Payment Terms: Encourages timely payments and improves cash flow.
Uniform Credit Policies: Reduces bad debt risk through structured credit approvals.
Error Reduction: Enhances efficiency and financial reporting accuracy.
Scalability: Supports increasing transaction volumes without process bottlenecks.
3. Preparing for Growth: Planning AR for Future Expansion
Scaling AR requires proactive strategies, from process optimisation to technology adoption and team readiness.
Steps to Prepare for Growth:
Assess Current Processes: Identify inefficiencies and areas for automation.
Anticipate Future Demands: Plan for customer expansion and rising transactions.
Invest in Scalable Solutions: Leverage AI-driven collections and forecasting tools.
Train the Team: Equip staff with skills to handle increasing complexity.
4. Data-Driven Decision Making: Advanced Reporting Tools and Dashboards
Advanced reporting tools and dashboards provide real-time visibility into key AR metrics like Days Sales Outstanding (DSO) and aging reports, enabling proactive management.
Key Benefits:
Early Risk Detection: High DSO signals inefficiencies in collections or payment terms.
Predictive analytics transforms AR from reactive to proactive financial management. By analysing historical payment trends, seasonal fluctuations, and macroeconomic factors, businesses can forecast cash flow, anticipate disruptions, and refine credit and collection strategies.
Key Benefits:
Improved Cash Flow Forecasting: Identifies potential shortfalls and minimises reliance on external financing.
Proactive Collections: Adjusts credit terms or intensifies collections based on past customer payment behaviours.
Risk Mitigation: Detects patterns that may signal financial distress, enabling early intervention.
For example, if customers frequently delay payments during peak seasons, predictive insights can prompt adjustments in credit terms or preemptive collection strategies.
6. Compliance and Financial Reporting: Ensuring Accuracy and Audit Readiness
Scalable AR systems should adhere to GAAP, IFRS, and other regulatory standards while maintaining financial accuracy.
Key Benefits:
Automated & Accurate Reporting: Reduces manual errors and ensures timely financial statements.
Real-Time Data Integrity: Provides audit-ready reports reflecting true business performance.
Embedded Audit Trails: Enhances transparency and supports internal and external audits.
Regulatory Compliance: Minimises risks of fines, penalties, or reputational damage.
By integrating automation, businesses can maintain compliance effortlessly, ensuring financial integrity while supporting growth.
Driving Growth With Scalable AR
Scaling AR isn’t just about handling more transactions—it’s about building a system that is agile, efficient, and future-ready. By leveraging scalable technology, standardising workflows, and equipping finance teams with the right skills, businesses can create resilient financial operations that support long-term growth.
However, what works today may need to evolve tomorrow. Staying competitive requires continuous improvement, a data-driven mindset, and openness to emerging technologies. AR professionals must refine strategies and embrace innovation to maintain agility in an ever-changing landscape.
Ultimately, scalable AR is a strategic investment in future success. With the right approach, businesses can navigate challenges, strengthen financial stability, and sustain growth in an increasingly dynamic market.
Leveraging Accounts Receivable Analytics for Financial Success
Introduction to AR Performance Tracking
In the previous module, we discussed the importance of building an effective and scalable Accounts Receivable (AR) process. However, setting up a solid AR foundation is just the beginning — true financial agility comes from continuously tracking performance.
Far from a nice-to-have, closely monitoring how your AR process performs over time gives businesses data-backed insight that accelerates collections and reduces bad debts. It’s essential for making smarter, faster decisions, strengthening working capital and optimising cash flow, ultimately keeping your business in the black.
As a result of this process intelligence, your business can:
Ensure steady cash flow: Timely collections mean your business can cover operational costs and fuel growth without scrambling for funds.
Reduce bad debts: The sooner you spot overdue invoices, the sooner you can chase them down (before they decide to ‘forget’ they owe you money).
Strengthen customer relationships: A well-managed AR process helps you resolve disputes smoothly, making for happier clients and more reliable payments.
Improve decision-making: Data-driven insights from tracking AR performance provide better forecasts, improved risk management, and smarter strategic planning.
Identify collection inefficiencies: If your invoices are dragging their feet or your follow-ups are lagging, tracking AR performance can highlight these delays and help you get back on track.
Enhance reporting & compliance: Accurate AR tracking ensures your financial reports are spot-on and compliant with regulations – a win-win for peace of mind.
AR Metrics: the Secret Sauce to Tracking AR Performance
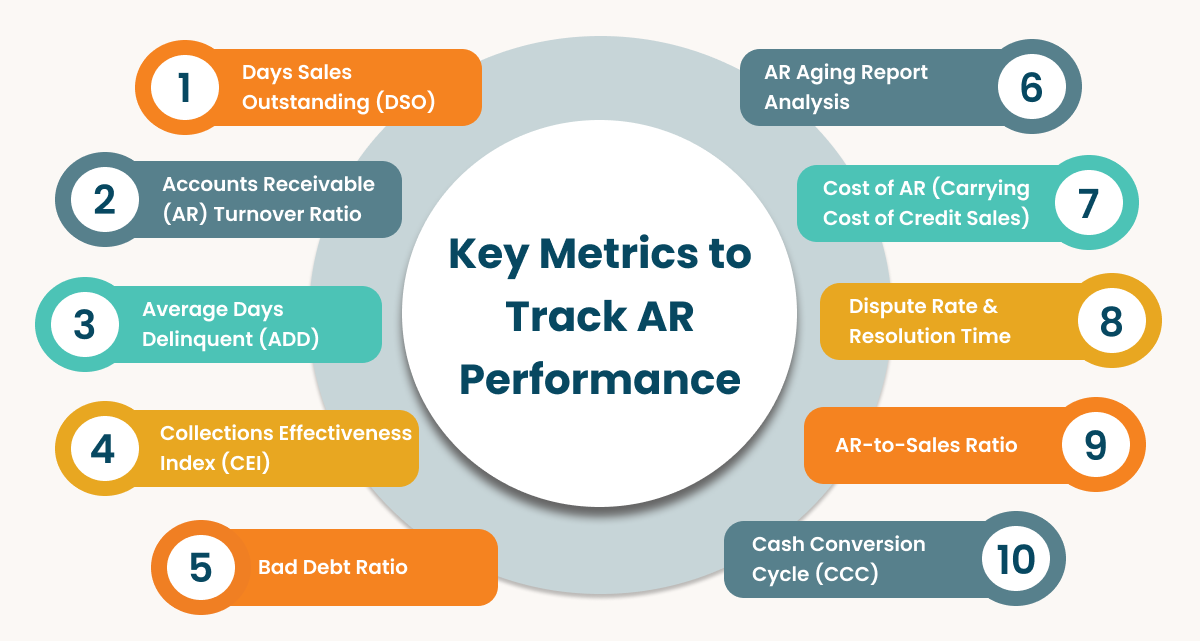
If AR performance tracking is the strategy, metrics are the tools that bring it to life. They provide the real-time data needed to spot risks, measure collection efficiency, adjust credit policies, and streamline operations. With the right metrics, you can forecast cash flow more accurately and support business growth — all while making sure your CFO doesn’t meltdown.
Now, let’s roll up our sleeves and dig into the key AR metrics that truly make a difference for businesses. By the end of this chapter, you’ll not only understand how to calculate these metrics — you’ll know how to leverage them to supercharge your financial decision-making and keep your business running like a well-oiled machine. Ready to dive in? Let’s go! 🚀
⚠️ Disclaimer: Industry benchmarks and insights provided in this chapter are general guidelines and may vary across sectors. It’s crucial to compare your company’s performance against relevant industry standards. These averages can change over time due to economic shifts, market trends, and sector-specific factors. For the most accurate and current information, it is advisable to consult up-to-date industry reports or financial professionals.
Days Sales Outstanding (DSO)
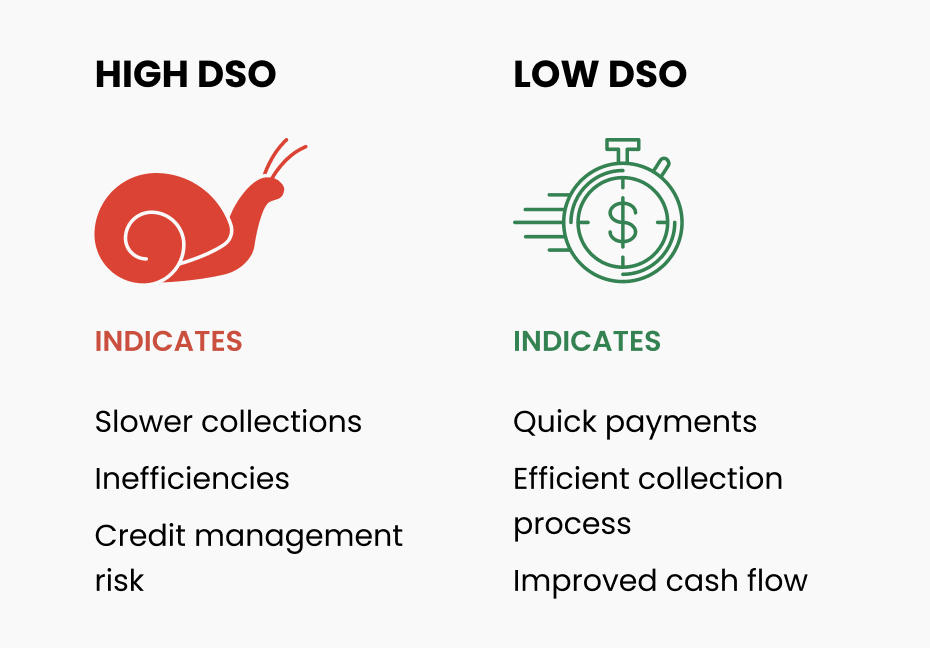
Days Sales Outstanding (DSO) is like your business's “waiting game” clock – it measures the average number of days it takes to collect payment after a sale is made. The lower the DSO, the faster your business gets paid, and the healthier your cash flow. Think of it as your business’s efficiency report card for collecting payments.
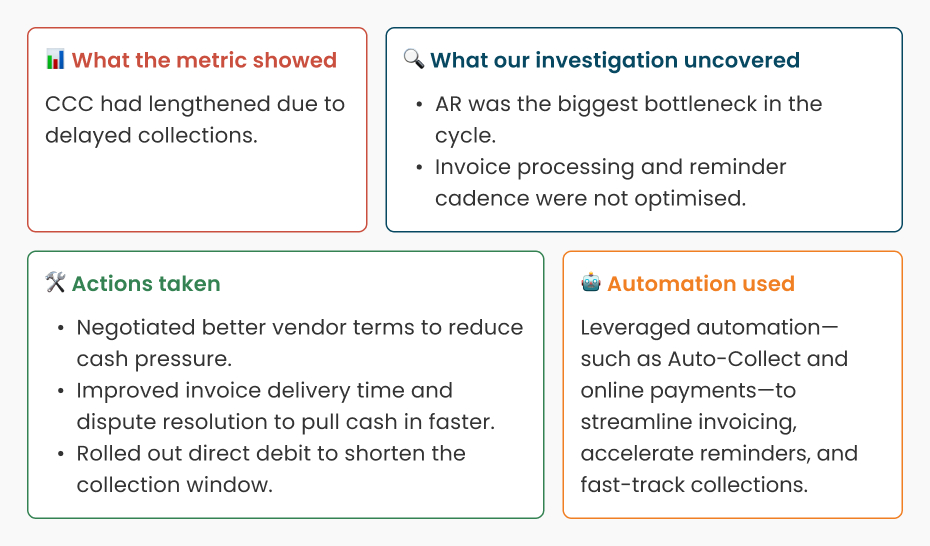
According to a J.P. Morgan report, the Cash Conversion Cycle (CCC) for S&P 1500 companies increased by 2.4 days in 2023, with 67% of these companies experiencing longer DSOs. This trend highlights the need for businesses to actively monitor and optimise their collection processes to maintain healthy cash flows.
EXAMPLE
N&N Ski Shop wants to assess their payment collection efficiency. Over the past 30 days, they reported:
- Total AR: $50,000
- Total Credit Sales: $200,000

Calculation: DSO = (50,000 / 200,000) × 30 = 7.5 days

This means that, on average, the company collects payments 7.5 days after a sale for its wholesale channel, indicating a low DSO.
Industry Insight
Low DSO (<15 days): Indicates strong collection practices and efficient credit management. Common in businesses with short payment cycles or strict credit terms, such as SaaS companies with monthly billing models.
Moderate DSO (30-45 days): Industry standard for many B2B companies. While not necessarily a concern, there may be room for improvement in collections.
High DSO (60+ days): Potential red flag indicating delays in collections, cash flow risks, or lenient credit policies. Businesses should investigate causes such as customer creditworthiness, invoicing inefficiencies, or weak follow-up procedures.
Best Practices for Improving DSO
Set clear payment terms and communicate them upfront.
Send timely reminders for overdue invoices.
Consider offering early payment discounts or implementing stricter policies for high-risk customers.
By regularly tracking DSO, businesses can pinpoint trends, improve cash flow, and streamline their accounts receivable processes.
Accounts Receivable (AR) Turnover Ratio
Debtors Turnover – measures how efficiently a company collects outstanding receivables over a specific period. Think of it as the speedometer 🏎️ for your business’s cash collection process.
This efficiency ratio shows how quickly and smoothly your company converts receivables into cash. It’s also a key metric for financial modelling.
EXAMPLE
N&N Ski Shop reports:
- Net Annual Credit Sales: $1,000,000
- Opening AR: $90,000
- Closing AR: $110,000

Calculation:
- Average AR = (90,000 + 110,000) ÷ 2 = $100,000
- AR Turnover Ratio = 1,000,000 / 100,000 = 10

An AR turnover ratio of 8 means the company is converting its accounts receivable into cash 10 times a year. By dividing the number of days in a year (365) by the AR turnover ratio (10), we get 36.5 days. This indicates that, on average, it takes 36.5 days to turn receivables into cash.
Industry Insight
Construction: The average AR turnover ratio in the construction industry is approximately 6 times per year. This is due to longer payment cycles common in construction projects, which may involve complex contracts and milestone-based payments.
Manufacturing: In the manufacturing sector, the AR turnover ratio typically averages around 7 times per year. Factors influencing this ratio include supply chain efficiency, the nature of the products, and the customer credit policies in place. Manufacturing businesses with longer production cycles or those relying on bulk orders may experience lower turnover ratios compared to companies with shorter production timelines.
Food and Beverage Distributors: The AR turnover ratio for food and beverage distributors tends to range from 10 to 14 times per year. This higher ratio is due to the often shorter payment terms and faster-moving inventory characteristic of the industry, where products are sold on quicker turnaround times and to a wider range of customers.
General Average:Across various industries, an AR turnover ratio of approximately 7.8 is considered the general benchmark. However, this can differ significantly depending on the industry’s characteristics, credit terms, and customer base.
Best Practices for Improving AR Turnover Ratio
Implement clear credit policies and payment terms.
Assess customer credit risk.
Follow up regularly on outstanding invoices.
Offer online payments and multiple payment methods.
Offer early payment discounts to encourage prompt settlements.
Monitoring the AR turnover ratio helps businesses identify collection trends and optimise cash flow management.
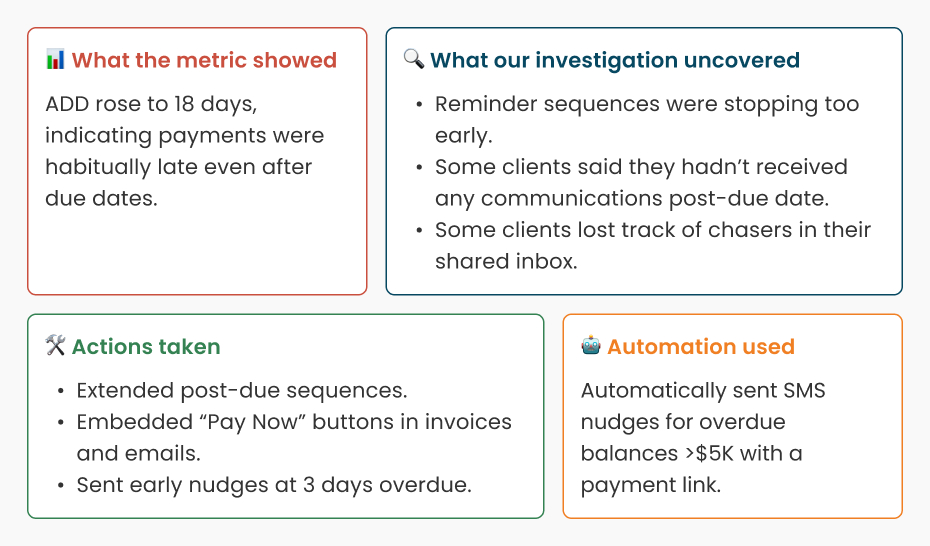
Average Days Delinquent (ADD)
ADD measures the average number of days payments are overdue, beyond the due date. Think of it as the "lateness tracker" ⏰ for your invoices!
It’s a crucial metric to evaluate how well your credit and collection processes are performing – and whether it's time to step up your efforts before those overdue payments get too comfortable.
EXAMPLE
N&N Ski Shop reports:
- DSO: 29 days
- Best Possible DSO: 10 days

Calculation: ADD = 29 - 10 = 19 days
Industry Insight
B2B Sectors (e.g., Construction, Manufacturing, Wholesales): These industries often experience higher ADD due to longer payment terms and project-based sales. The average ADD typically ranges from 30 to 60 days. Long-term contracts, larger invoices, and complex projects can contribute to slower payments, especially if customers require extended time to assess the deliverables before making payments.
Retail and SaaS Companies: These industries generally experience lower ADD due to quicker payment cycles and subscription-based models. Retail businesses usually deal with shorter credit terms, while SaaS companies often collect payments upfront or on a recurring basis. In particular, they often aim for an ADD closer to 10-15 days to maintain consistent cash flow.
Other Factors Influencing ADD: Industries such as Healthcare and Education may see varying ADD trends. Healthcare providers often have longer payment cycles due to insurance reimbursements, while educational institutions might face slow payments from other educational institutions or corporate clients due to contractual terms and lengthy approval processes. These sectors can typically have ADDs in the 40-90 days range.
Best Practices for Managing ADD
Regularly review customer payment histories to identify potential risks.
Strengthen credit policies to minimise overdue payments and improve cash flow.
Implement automated payment reminders to encourage timely collections.
Offer early payment discounts or enforce stricter late payment penalties.
By closely monitoring ADD, companies can maintain better control over cash flow and reduce the risk of financial instability caused by slow-paying customers.
Collections Effectiveness Index (CEI)
Collections Effectiveness Index (CEI) measures a company’s efficiency in collecting its outstanding receivables during a specific period.
A higher CEI percentage means you’re collecting those payments like a pro, helping maintain liquidity and making sure your operations run like a well-oiled machine.
Think of it as a measure of your cash collection hustle – if you’re rocking a high CEI, it means your team is on point, efficiently converting credit sales into cash and keeping that cash flow smooth.
EXAMPLE
N&N Ski Shop reports:
- Beginning AR: $80,000
- Credit Sales: $200,000
- Ending AR: $50,000
- Ending Current AR (not yet due): $30,000

Calculation: CEI = [(80,000 + 200,000 – 50,000) / (80,000 + 200,000 – 30,000)] × 100 = 92%

This CEI score of 92% indicates that N&N Skip Shop has been very effective at converting its credit sales into cash, as 92% of the outstanding receivables have been successfully collected or are still within due dates.
Industry Insight
B2B Sectors (e.g., Construction, Manufacturing, Wholesales): In industries with longer payment cycles like construction or manufacturing, the CEI score can fluctuate due to project-based sales and longer credit terms. A CEI of 80% is considered good for these sectors.
Food and Beverage Distributors: These businesses tend to have shorter collection periods, so maintaining a high CEI of around 90% or above is a good indicator of effective collections.
Retail & SaaS: Retailers and SaaS companies, which generally experience faster payment cycles, may aim for a CEI score above 90%, reflecting their quicker conversion of receivables into cash. For SaaS companies, managing collections becomes more important as subscription models often rely on recurring payments.
Best Practices for Improving CEI
Automate payment tracking and reminders.
Segment customers by creditworthiness.
Follow up with slow payers and set clear expectations.
Offer incentives for early payments.
By regularly tracking and improving the CEI, businesses can optimise their cash flow, reduce credit risk, and enhance financial stability.
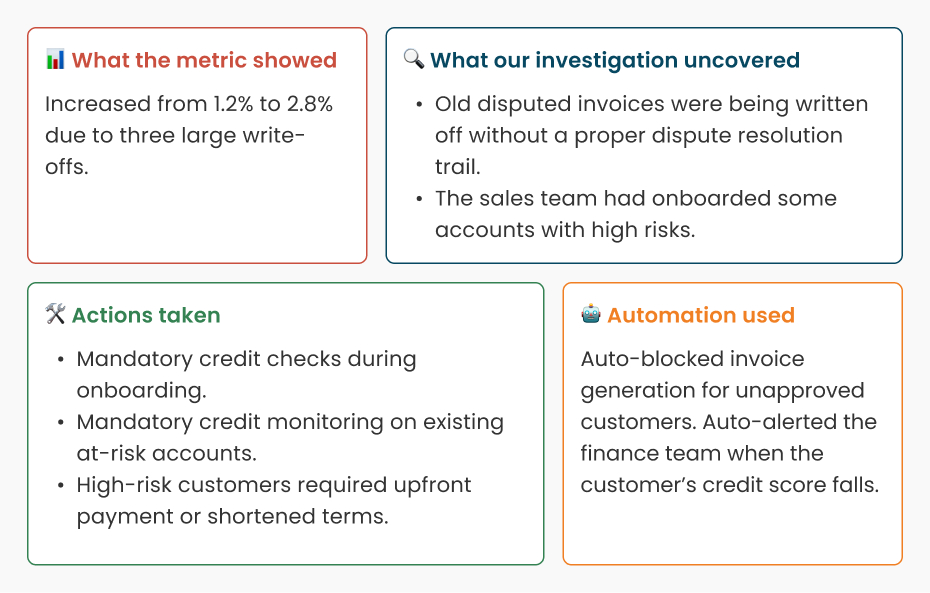
Bad Debt Ratio
Bad Debt Ratio is the financial “red flag” 🚩 that helps you see where your credit policies might be going off-track! This metric is key for understanding how much of your credit sales are at risk of not being paid.
By comparing bad debts (those amounts you won’t be seeing again) to total credit sales, businesses can get a better grasp on their credit risk and its financial impact. s especially critical for companies that offer credit, as it highlights the portion of revenue that could be lost to non-payment, which, when written off, can significantly impact financial performance. Keeping an eye on this ratio helps ensure your credit strategy is both smart and sustainable.
EXAMPLE
N&N Ski Shop reports:
- Bad Debts: $5,000
- Credit Sales: $200,000

Calculation: Bad Debt Ratio = (5,000 / 200,000) × 100 = 2.5%

This means that 2.5% of the company’s credit sales are expected to become uncollectible, which might be acceptable for businesses with higher-risk clientele or longer payment terms. However, for a 100% retail business, this would prompt a review of their collection policy.
Industry Insight
Construction: The long project timelines and large contracts often result in extended payment cycles, leading to higher bad debt ratios. Project-based sales and the reliance on client-specific financing contribute to a ratio in the 5% to 7% range. It’s crucial for companies in this industry to implement robust contract terms and regular payment follow-ups to manage risk.
Manufacturing: Similar to construction, the manufacturing industry often deals with large contracts and longer payment terms, which can contribute to higher bad debt ratios. Manufacturers with high-value products may experience ratios of 5% to 6%, especially when payments are linked to project milestones or long-term orders. Proper risk assessment and credit management processes are essential to mitigate potential losses.
Wholesale & Distribution: In wholesale and distribution, companies may experience higher ratios due to longer payment cycles with large retail clients or resellers. With the typical practice of extending credit for bulk purchases, ratios can climb, especially if clients are struggling with cash flow.
B2B Sectors: In general, companies operating in B2B markets, such as technology solutions or industrial equipment suppliers, may face higher Bad Debt Ratios due to the nature of large transactions and customised payment terms. These industries may see ratios around 5-7%, though they still need to stay vigilant in managing customer credit risk.
Best Practices for Managing Bad Debt Ratio
Pre-screen customers: Conduct credit checks during onboarding and before offering credit.
Review credit limits: Adjust limits based on payment behavior.
Tailor payment terms: Offer longer terms for reliable customers, shorter for high-risk clients.
Monitor payment trends: Track payments and adjust strategies.
Tighten credit policies: Limit credit for customers with poor histories.
Offer shorter terms: Minimize delinquencies by shortening payment windows.
Use credit insurance: Protect large transactions with insurance or guarantees.
By regularly monitoring the Bad Debt Ratio, businesses can adjust their credit policies and collections strategies to maintain a balance that minimises risk and ensures financial stability.
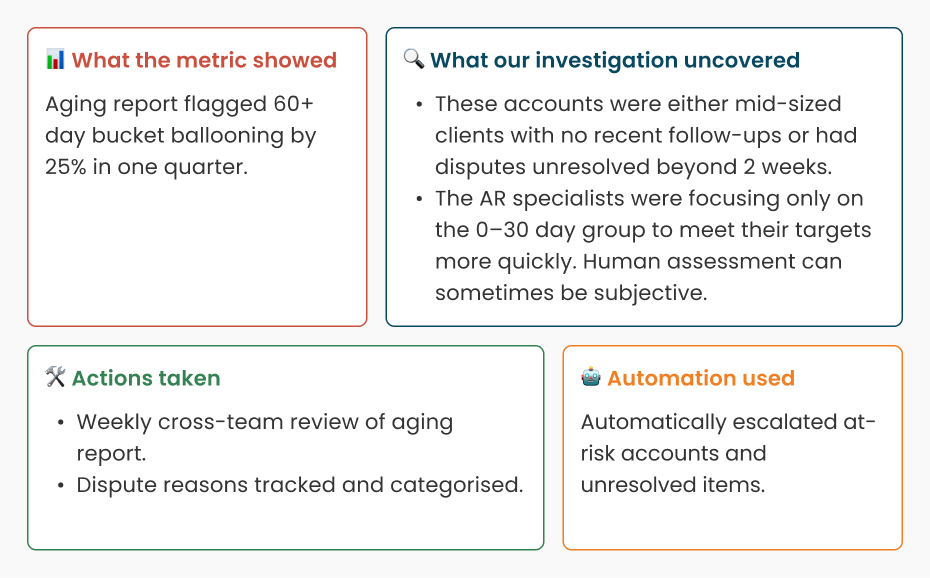
AR Aging Report Analysis
An AR Aging Report is like your business’s crystal ball 🔮, showing which customers are slacking on their payments. This nifty report helps determine who needs a friendly nudge and can seriously boost your collection efforts. It categorises outstanding invoices by how long they’ve been overdue.
Typical AR Aging Report Categories
Current: Invoices not due yet (a sigh of relief for now).
30-60 Days Past Due: Time to start keeping an eye on these folks.
60-90 Days Past Due: Now we’re in serious territory. Follow-up time!
Over 90 Days Past Due: Sound the alarm! These need immediate attention
The analysis is crucial for businesses to identify slow-paying customers, assess potential cash flow issues, and prioritise collections. It allows businesses to track trends in late payments, ensuring that overdue amounts are tackled promptly.
EXAMPLE
N&N Ski Shop reviews its AR aging report and discovers that 30% of receivables from their wholesale clients are over 60 days overdue, while only 10% of receivables from retail customers are outstanding for more than 30 days. This indicates that the wholesale channel is facing a slower payment cycle, which could impact cash flow. The company decides to prioritise collections efforts in the wholesale sector and review credit terms for these clients to reduce the risk of bad debt and improve liquidity.
Industry Insight
Construction & Manufacturing: These industries often have longer payment cycles due to large projects and custom orders. AR aging reports may show significant amounts in the 30-60 day and 60+ day buckets, as clients delay payments until project milestones are met or goods are received.
Wholesale & Distribution: Longer payment terms are common in wholesale and distribution businesses, often leading to significant amounts in the 30-60 day buckets. Companies in this sector might offer payment terms based on customer volume, increasing risk of delayed payments.
Tech & Telecom: Tech and telecom companies can experience slower payments from customers due to contract complexities and disputes. AR aging reports for these sectors often show a mix of 30-day and 60+ day receivables, particularly for large corporate clients.
Retail: Retailers generally see shorter aging periods due to high cash sales or quick payment cycles. However, for businesses offering credit to customers, AR aging reports may show a concentration in the 30-day bucket, with slower payments from high-ticket items or larger customers.
SaaS & Subscription-Based Models: These industries often have lower aging, with customers paying on time via automated systems. AR aging reports typically show few accounts in the 30+ day buckets, as recurring payments minimize the risk of delayed payments.
Best Practices for Managing AR Aging
Segment customers by payment behavior: Use an automated AR system to classify customers based on payment history.
Implement stricter follow-up protocols: Set reminders for overdue payments and engage with customers promptly.
Introduce early payment discounts or penalties for overdue payments: This can motivate customers to pay faster.
Regularly monitor AR aging reports: Focus on receivables that are past due for more than 60 days.
Regularly reviewing your AR aging helps identify late payments early, improve cash flow, prioritise collections, monitor credit risk, and ensure accurate financial reporting.
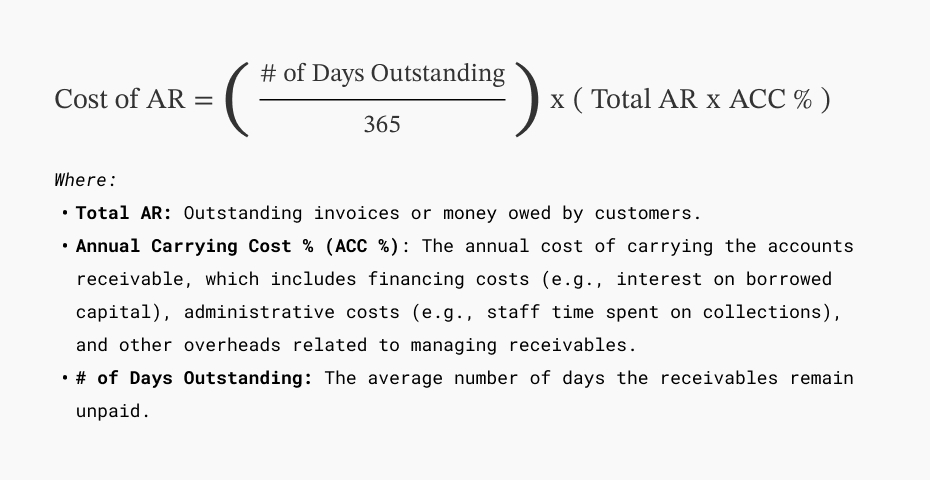
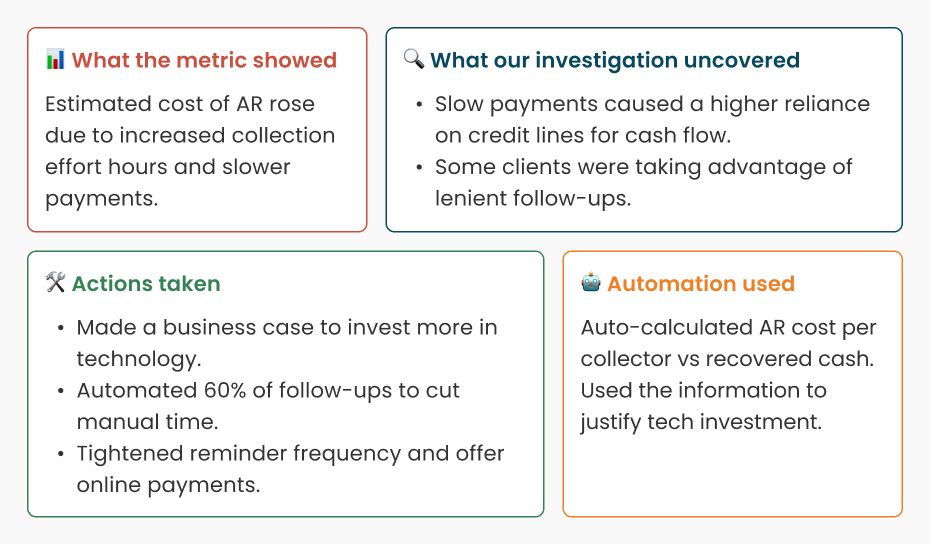
Cost of AR (Carrying Cost of Credit Sales)
Cost of AR is like the hidden expense of carrying a shopping cart full of unpaid invoices – it’s the financial price you pay for offering credit to customers.
The higher the cost, the more likely you're carrying around a burden that is tying up your cash and resources. If your cost of AR is too high, it’s a red flag that your credit policies or collections strategies may need some serious tweaking to avoid that financial burden.
This metric takes into account the interest on borrowed funds, administrative costs to down those elusive payments, and the risk of bad debts that may never be settled. Think of it as a tally of all the behind-the-scenes work that goes into managing those receivables.
EXAMPLE
N&N Ski Shop reports:
- AR Balance: $100,000
- Annual Carrying Cost Rate: 20%
- Number of Days Outstanding: 30

Calculation: Cost of AR = ($100,000 × 20%) × (30 / 365) = $1,644

Thus, the Cost of AR for N&N Skip Shop is $1,644 for the 30 days their receivables remain outstanding.
Industry Insight
Cost of AR varies significantly across industries due to differences in payment cycles, credit terms, and customer types. Here's a breakdown of typical benchmarks:
Manufacturing and Construction: 5% – 10% of total AR. These industries typically have longer payment cycles due to large contracts and project-based work, resulting in higher carrying costs.
Wholesale Distribution: 3% – 6% of total AR. Wholesale businesses tend to offer longer payment terms, which can result in higher carrying costs due to delayed payments, especially for larger transactions.
Professional Services (Legal, Consulting, etc.): 5% – 8% of total AR. Professional services typically deal with larger contracts and project-based billing, resulting in longer payment terms and higher carrying costs.
Retail: Benchmark Range: 1% – 3% of total AR. Retail businesses usually have short payment cycles, particularly with cash or card-based transactions, leading to lower carrying costs.
Best Practices for Managing Cost of AR
Assess creditworthiness: Offer credit terms based on customer risk profiles.
Improve efficiency: Automate manual AR processes to cut administrative costs.
Review credit policies: Regularly update credit terms based on customer behaviour and trends.
Early payment incentives: Offer discounts to encourage early payments and reduce AR balances.
By keeping a close eye on the Cost of AR, businesses can proactively manage their financial resources, reduce unnecessary expenses, and improve overall cash flow management. Adjusting collection strategies and credit policies in response to industry trends can help reduce the carrying cost of outstanding receivables.
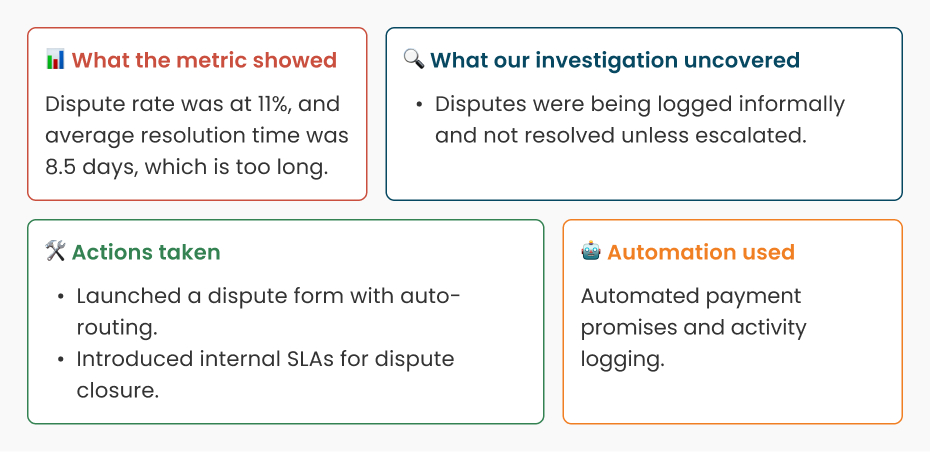
Dispute Rate and Resolution Time
Dispute Rate and Resolution Time are your business's "dispute detectives" 🕵️♂️, shining a light on how well your team handles customer complaints and discrepancies.
The Dispute Rate tracks the percentage of invoices that customers challenge – whether it's a pricing issue, delivery hiccup, or a product mismatch. Resolution Time, on the other hand, measures how fast your team solves these problems and gets things back on track.
Keeping an eye on both metrics is key to spotting inefficiencies in your invoicing or collections process. A high dispute rate or slow resolution time can cause cash flow headaches, but nipping these issues in the bud can smooth out your payments and keep your business running like a well-oiled machine!
EXAMPLE
N&N Ski Shop reports:
- Disputed Invoices: 10
- Total Invoices: 1,000
- Total Days to Resolve Disputes: 50

Calculation:
- Dispute Rate = (10 / 1,000) × 100 = 1%
- Resolution Time = 50 / 10 = 5 days
Industry Insight
Manufacturing & Construction:
Dispute Rate: 5-10% due to the complexity of project-based sales and long contracts.
Resolution Time: 10-30 days, driven by the intricate details of projects and multiple stakeholders.
Combined Insight: Manufacturing and construction industries face the highest dispute rates and longest resolution times due to the complexities of large-scale projects and extended timelines.
B2B / Wholesale:
Dispute Rate: 3-5% due to more complex contracts and transactions.
Resolution Time: 7-14 days, often tied to intricate contract details.
Combined Insight: Higher dispute rates and longer resolution times are typical, as B2B transactions often involve more detailed agreements and customised pricing.
Retail:
Dispute Rate: 1-2% due to simpler transactions.
Resolution Time: 2-5 days for straightforward issues.
Combined Insight: Retail generally has lower dispute rates and faster resolution times, thanks to clear pricing and simpler billing systems. The majority of complaints would be resolved via return and refund policies.
SaaS & Subscription:
Dispute Rate: 2-3%, mainly stemming from billing issues.
Resolution Time: 3-7 days, as disputes usually revolve around subscription renewals and service charges.
Combined Insight: SaaS companies have moderate dispute rates, but their quick resolution times help minimise cash flow disruptions, particularly with recurring billing models.
Best Practices for Managing Dispute Rate & Resolution Time
Improve invoice accuracy: Continuously review and enhance your invoicing process to minimise errors and prevent disputes.
Ensure clear communication: Provide clear terms, conditions, and itemised invoices to avoid misunderstandings.
Act swiftly on disputes: Set a target to resolve disputes within 3-5 days to maintain cash flow and customer satisfaction.
Leverage automation: Use automated systems to track disputes, improving visibility and speeding up resolution.
Tracking Dispute Rate and Resolution Time is crucial for maintaining healthy cash flow and improving operational efficiency by resolving payment issues quickly. It also helps foster stronger customer relationships and ensures that financial risks, such as bad debts, are minimised.
AR-to-Sales Ratio
AR-to-Sales Ratio is like a financial radar, measuring how much of your hard-earned revenue is still sitting in receivables instead of flowing into your cash reserves.
It’s an essential metric for understanding how efficiently your business is collecting payments – too high, and it might be time to rethink your collection strategy, too low, and you’re probably doing a great job keeping cash coming in!
EXAMPLE
N&N Skip Shop reports:
- Total AR: $100,000
- Total Sales: $500,000

Calculation: AR-to-Sales Ratio = (100,000 / 500,000) × 100 = 20%

This indicates that 20% of the business's sales are currently outstanding, tied up in receivables.
Industry Insight
The AR-to-Sales Ratio can vary significantly across industries due to differing payment cycles, credit terms, and customer bases. Below are some industry-specific insights and benchmarks:
Manufacturing and Construction: 25% – 50%. These industries typically experience longer payment cycles due to large contracts and project-based sales, meaning a higher AR-to-Sales ratio is common. Extended credit terms and delayed payments from contractors or clients can push this ratio higher.
Wholesale Distribution: 15% – 25%. Wholesale businesses may face higher AR-to-Sales ratios due to longer payment terms extended to customers, particularly in B2B transactions. The ratio could vary depending on industry-specific factors such as order size and customer payment practices.
Telecommunications: 10% – 20%. Telecom companies typically have a relatively lower AR-to-Sales ratio as most customers pay on a regular, subscription basis. However, payment delays or bad debt can still affect the ratio, especially for corporate clients with large outstanding balances.
Professional Services (Legal, Consulting, Accounting, etc.): 20% – 40%. Professional services often see a higher AR-to-Sales ratio due to project-based work with varying timelines for payment, especially if clients are on long payment terms or the work is dependent on client invoicing.
Best Practices for Managing AR-to-Sales Ratio
Strengthen credit policies: Assess customer payment history and adjust credit limits accordingly.
Monitor AR closely: Track aging receivables and follow up promptly on overdue invoices.
Optimise payment terms: Align terms with customer reliability; shorten for high-risk accounts.
Encourage early payments: Offer discounts or incentives for prompt payments.
Automate collections: Use invoicing and payment reminders to speed up cash flow.
Review contracts: Ensure credit terms align with industry norms and business needs.
By focusing on improving the AR-to-Sales Ratio, companies can enhance liquidity, reduce financial strain, and optimise cash flow management, allowing for smoother operations and better financial health.
Cash Conversion Cycle (CCC)
Cash Conversion Cycle (CCC) is like a stopwatch for your business, measuring how long it takes to turn your inventory and receivables into cold, hard cash! It tracks the journey from purchasing inventory, through making sales, and finally, receiving payment.
The quicker this cycle, the faster your business is generating cash and keeping operations flowing smoothly.
EXAMPLE
N&N Ski Shop reports:

- DIO: 20 days
- DSO: 40 days
- DPO: 30 days

Calculation: CCC = 20 + 40 – 30 = 30 days

N&N Ski Shop takes 30 days to convert inventory into cash after paying suppliers.
Industry Insight
Manufacturing & Construction: CCC extends to 60–120 days due to long production cycles, project-based billing, and extended payment terms. These industries often rely on milestone-based payments, making cash flow management critical.
Wholesale & Distribution: CCC typically falls between 30–90 days, depending on supplier and customer payment terms. Longer CCC may arise from bulk purchasing and extended B2B credit terms, while businesses with strict credit policies and fast-moving inventory can maintain a shorter CCC.
Retail & E-commerce: CCC typically ranges from 0–30 days, as businesses benefit from high inventory turnover and fast customer payments, often through cash or card transactions. Efficient supply chain management and automated payment processing help keep CCC low.
SaaS & Subscription Services: Often have a negative CCC, as payments are collected upfront before incurring costs. Subscription models provide steady cash flow, reducing reliance on receivables and inventory. Efficient billing automation further optimises CCC.
Best Practices for Managing CCC
Reduce DIO: Optimise inventory levels to improve turnover.
Accelerate DSO: Strengthen collections processes and offer incentives for early payments.
Optimise DPO: Negotiate supplier terms to extend payables without harming relationships.
Brain Exercise
You've explored key AR metrics — now it's time to apply what you've learned. Can you crack the numbers and identify where N&N Skip Shop stands?
Challenge yourself with these calculations and discover how you can improve your financial health. Are you ready to show off your AR expertise? Let's go!
SAMPLE SCENARIO
N&N Ski Shop is experiencing cash flow strain due to delayed payments from wholesale customers. The finance team is assessing their AR performance to identify areas for improvement.

N&N Ski Shop’s recent AR data:
- Total AR: $120,000
- Total Credit Sales (Last 30 Days): $400,000
- Opening AR: $100,000
- Closing AR: $140,000
- Best Possible DSO: 20 days
- Overdue AR (Past Due >30 Days): $50,000
Questions
Calculate the company's DSO.
Determine the AR Turnover Ratio.
Calculate the Average Days Delinquent (ADD).
What percentage of AR is overdue, and what does this indicate?
Bonus: If the company wants to reduce DSO to 25 days, how much should they collect over the next 30 days to achieve this target?
What strategic actions can improve cash flow and reduce overdue AR?
From Metrics to Magic: a Real-life Example
Real-Life Example: How N&N Ski Shop Used AR Metrics to Improve Collections
In FY25 Q3, N&N Ski Shop noticed a slowdown in collections. A sudden dip in cash flow triggered a cross-functional investigation. The finance team pulled data across the Top 10 AR metrics, uncovering patterns that helped drive targeted action.
Here’s how the story unfolded:
Day Sales Outstanding (DSO)
AR Turnover Ratio
Average Days Delinquent (ADD)
Collections Effectiveness Index (CEI)
Bad Debt Ratio
AR Aging Report Analysis
Cost of AR
Dispute Rate & Resolution Time
AR-to-Sales Ratio
Cash Conversion Cycle (CCC)
The Result
Within 8 weeks, by focusing on these 10 metrics and tying actions to automation:
DSO improved by 8 days.
CEI rose back to 91%.
Collections productivity increased 2.3x.
Dispute resolution time dropped to 3.8 days.
$280K in overdue payments recovered.
Managing AR is a lot like surfing: you need to stay on top of the wave (aka your metrics) while avoiding the wipeouts (aka overdue accounts).